Generic selectors
Exact matches only
Search in title
Search in content
Post Type Selectors

Popular stocks

Crypto

CFD

Currencies

Support

Gold

BTC/USD – Technical Analysis – 4h

January 7, 2026 08:04

Quick Summary

The Bitcoin chart reflects a recent correction following a bullish trend.

There is consolidation around key levels indicating potential for a strong move.

Investors should be cautious and look for confirmation signals for the next direction.

Candlestick Analysis

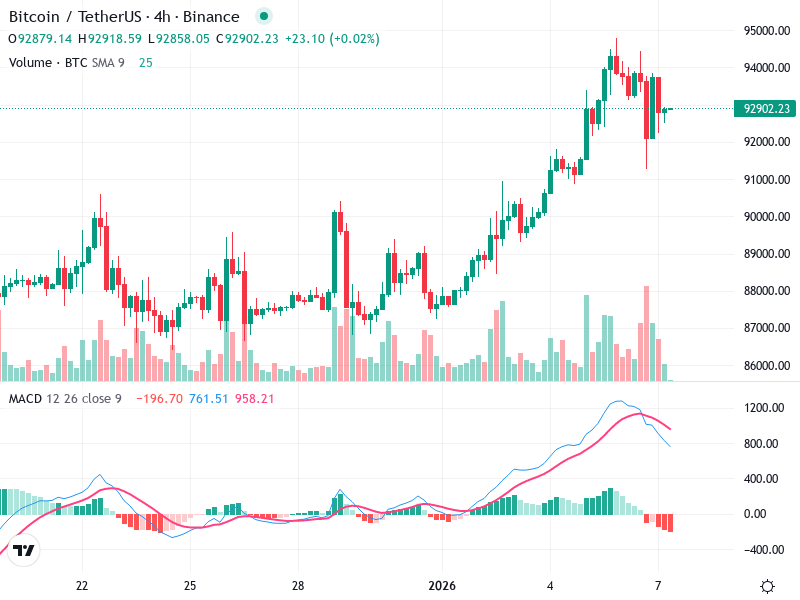
There is a notable bullish trend leading up to a recent pullback. A potential reversal candlestick formation is seen with a long lower wick, indicating buyer interest around the current level.

The chart shows a strong prior bullish trend with a recent consolidation and slight correction, suggesting possible continuity of the uptrend.

The area around 94,000 acted as resistance, with current support forming near 92,000. A breakout above this range could re-initiate the upward momentum.

MACD Analysis

The MACD line has crossed below the Signal line, suggesting bearish momentum is currently dominant. However, it's worth noting that this is a sharp pullback following a strong rally.

The histogram indicates decreasing bearish momentum, with the bars starting to shrink in size. This could be an early indication of a potential bullish reversal.

No clear divergence is observed currently, but a close watch is needed for any emerging bullish signals.

Volume Analysis

A spike in volume occurred during the recent downturn, indicating strong selling pressure, but the current lower volume suggests this pressure might be easing.

Volume has not supported the slight recovery yet, suggesting caution as the uptrend attempts to resume.

There was an institutional activity indication during the recent high-volume sell-off, often pointing to a potential reversal area since it follows a rapid price increase.

Support & Resistance

Support: Approximately 92,000 is a key support level, tested multiple times.

Resistance: Near 94,000 is a key resistance point. A breach above could indicate a resumption of the uptrend.

These levels form the current trading range and will be critical in defining the next significant price movement.

Actionable Insights

Consider entry near 92,000 support if bullish signals confirm, such as a MACD crossover or a bullish candlestick pattern.

Watch for resistance near 94,000; consider taking profits if the price shows weakness there.

For existing long positions, holding is advised unless a clear break below 92,000 occurs.

The AI Technical Analysis Center is an informational tool only and does not constitute investment or trading advice.
This site is registered on wpml.org as a development site. Switch to a production site key to remove this banner.