Generic selectors
Exact matches only
Search in title
Search in content
Post Type Selectors

Popular stocks

Crypto

CFD

Currencies

Support

Gold

BTC/USD – Technical Analysis – 4h

January 9, 2026 08:05

Quick Summary

The chart for Bitcoin /TetherUS reveals critical levels and potential future movements. The asset’s recent price action indicates significant patterns and potential trading opportunities. With its current market conditions, traders should stay alert to potential shifts in momentum.

Candlestick Analysis

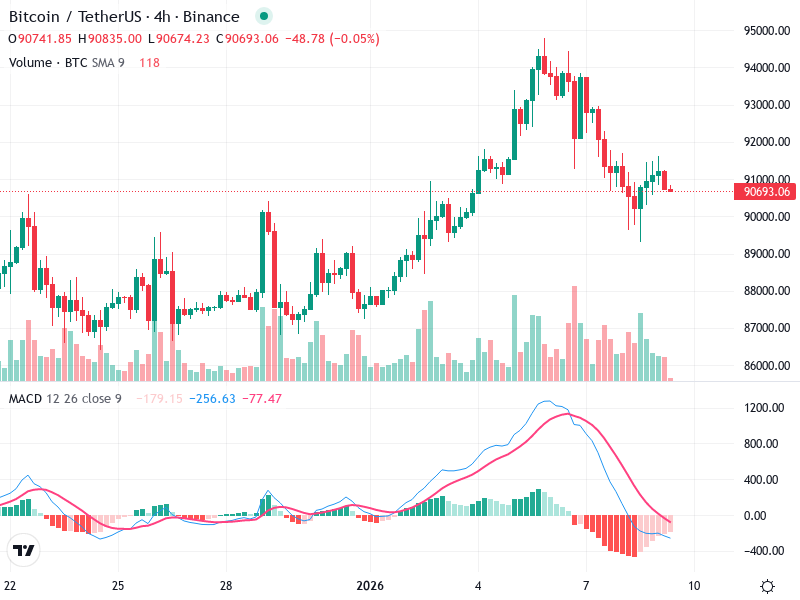
Significant Patterns: There are signs of bullish momentum leading up to early January, followed by a clear correction. A `doji` appears recently, indicating indecision in the market.

Overall Trend: The trend was initially bullish, peaking around the beginning of the year. This was followed by a bearish correction, and currently, a sideways movement is evident.

Breakout/Pullback Zones: The peak close to 94,000 indicates a resistance level, while the 90,000 level seems to be a recent support zone.

MACD Analysis

MACD Line vs. Signal Line: A bearish crossover is visible where the MACD line crossed below the signal line around the peak, indicative of selling pressure.

MACD Histogram: The histogram shows decreasing momentum in the bearish trend, suggesting potential consolidation or a reversal.

Divergences: No clear divergence is visible, but the shrinking histogram could signal a shift in momentum.

Volume Analysis

Volume Trends: Elevated volume on the recent bullish trend indicates strong buyer interest. Volume has decreased during the correction, showing less aggressive selling.

Volume and Price Movement: The reduced volume during the pullback might suggest a lack of conviction in the sell-off.

Unusual Spikes: No unusual spikes suggesting institutional activity are present in the current timeframe.

Support & Resistance

Resistance Levels: 94,000 is confirmed as a resistance level due to the recent price rejection.

Support Levels: 90,000 appears to be holding as solid support, managing to halt the recent bearish momentum.

Actionable Insights

Possible Strategies: Consider a `buy` strategy on confirmation of support around 90,000 with a tight stop-loss below this level. Watch for bullish candlestick patterns or a MACD bullish crossover for confirmation.

Near-term Watchlist: Monitor volume for increases during price movements to confirm trend strength. Watch for a breakout above 94,000 for renewed bullish momentum.

Market Sentiment: The recent sideways movement and the presence of neutral doji candles suggest market indecision, requiring careful observation for new trends.

The AI Technical Analysis Center is an informational tool only and does not constitute investment or trading advice.
This site is registered on wpml.org as a development site. Switch to a production site key to remove this banner.