Generic selectors
Exact matches only
Search in title
Search in content
Post Type Selectors

Popular stocks

Crypto

CFD

Currencies

Support

Gold

BTC/USD – Technical Analysis – 4h

January 13, 2026 08:04

Quick Summary

The analysis of the asset displays interesting patterns that suggest potential upward momentum. The chart transitions from a bearish to a more bullish stance, indicating possible future gains.

Investors might find promising opportunities based on current technical indicators.

Candlestick Analysis

The chart shows a sideways movement with several small-bodied candles indicating indecision.

There are hints of bullish momentum as evident by some larger green candles.

The overall trend has transitioned from bearish to a more bullish side with higher lows after the initial downtrend.

MACD Analysis

The MACD line is currently above the Signal line, indicating bullish momentum.

The MACD histogram is positive and showing increasing bars, suggesting gathering momentum.

There is no significant divergence between the MACD and price action, aligning with the upward price movement.

Volume Analysis

There is an increase in volume during upward movement, supporting the bullish price action.

The higher volume on green candles versus red candles indicates market participants favor the upward price action.

No significant unusual volume spikes are indicating institutional activity, but consistent volume increase is supportive.

Support & Resistance

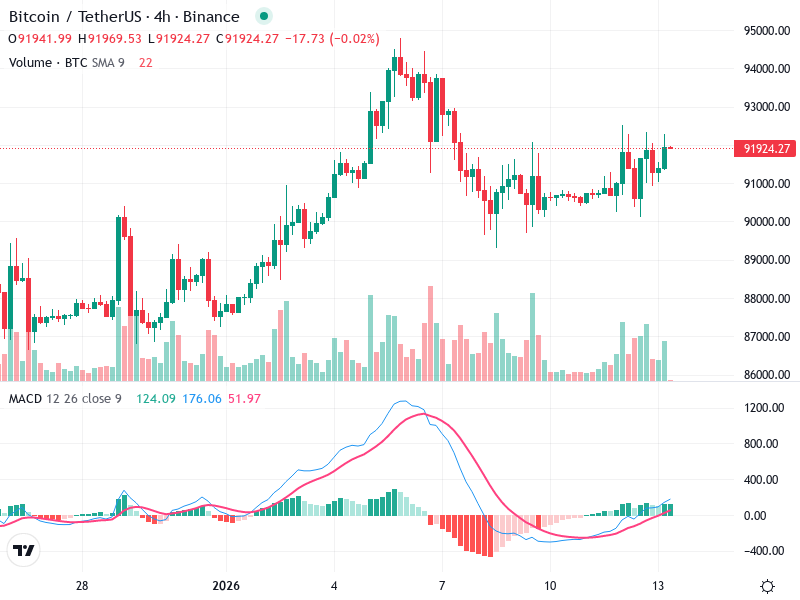
Support is around 90000, as evidenced by the price holding at these levels on multiple occasions.

Resistance is around 93000, the previous peak area that needs to be breached for further bullish confirmation.

These levels are crucial for potential reversals, and a breakout above 93000 would likely ignite bullish momentum.

Actionable Insights

Consider entry if the price firmly breaks above 93000 with supportive volume.

Traders might look to take profit near 93000 if there's failure to break through and the price starts showing weakness.

Holding is advisable as long as the price stays above 90000, watching for any changes in MACD or volume patterns.

The AI Technical Analysis Center is an informational tool only and does not constitute investment or trading advice.
This site is registered on wpml.org as a development site. Switch to a production site key to remove this banner.