Generic selectors
Exact matches only
Search in title
Search in content
Post Type Selectors

Popular stocks

Crypto

CFD

Currencies

Support

Gold

BTC/USD – Technical Analysis – 4h

January 15, 2026 08:04

Quick Summary

The Bitcoin /TetherUS chart exhibits a strong upward trend from late December to mid-January, characterized by a breakout above significant resistance levels. Current analysis suggests potential for continued upward momentum if key support holds.

Candlestick Analysis

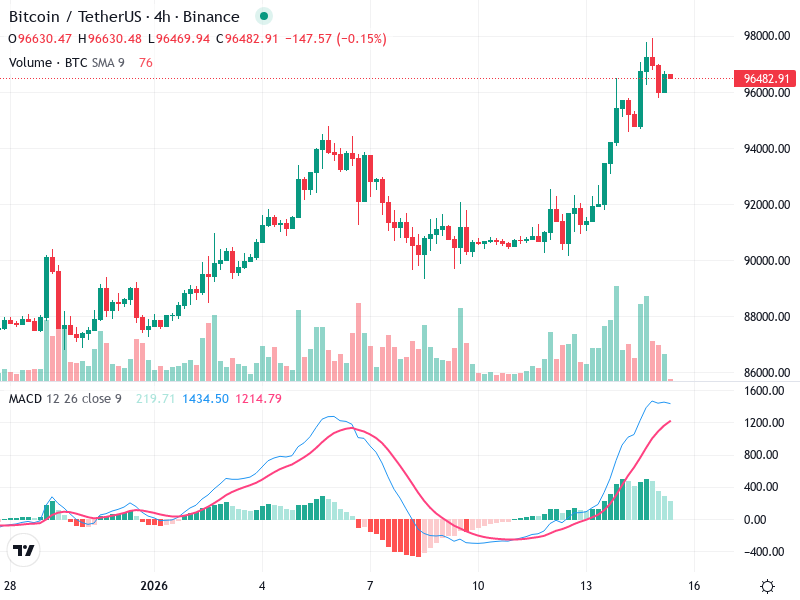
The chart shows a strong bullish trend from late December to mid-January, with consolidation at higher levels.

A bullish engulfing pattern suggests strong buying interest, while a doji pattern indicates potential indecision.

The price currently consolidates above previous resistance at the 94000 level, suggesting potential support.

MACD Analysis

There is a bullish crossover where the MACD line crosses above the Signal line, indicating positive momentum.

The histogram is positive and expanding, which suggests increasing bullish momentum.

No significant divergences have been observed, supporting the current uptrend.

Volume Analysis

Volume increased significantly during the breakout, providing strong support for the price movement.

There is a slight decline in volume during consolidation, indicating traders may await further confirmation.

Sharp spikes in volume during upward moves suggest possible institutional buying.

Support & Resistance

Support is identified around 94000, where the price sustains after the breakout.

Resistance is near 97000, a level where the price has struggled to maintain upward momentum.

The consolidation phase is indicative of traders' caution at these levels.

Actionable Insights

Consider buying on pullbacks near support around 94000 if the price action holds above this level with supporting volume.

If holding, watch for a break below 94000 as an exit signal. Partial profit-taking may be considered near 97000 resistance.

A confirmed breakout above 97000 with strong volume could prompt a continued bullish trend.

The AI Technical Analysis Center is an informational tool only and does not constitute investment or trading advice.
This site is registered on wpml.org as a development site. Switch to a production site key to remove this banner.