Generic selectors
Exact matches only
Search in title
Search in content
Post Type Selectors

Popular stocks

Crypto

CFD

Currencies

Support

Gold

BTC/USD – Technical Analysis – 4h

January 19, 2026 08:04

Quick Summary

The analysis of the asset’s chart reveals a recent shift in sentiment marked by notable price movements. Technical indicators suggest a potential continuation of prevailing trends. Investors should be aware of key price levels and market signals for their next move.

Candlestick Analysis

A large bearish candlestick is visible recently, indicating a strong selling pressure.

The presence of a long lower wick suggests some buying interest at lower levels, possibly hinting at a support zone.

The recent trend is bearish after a period of bullish momentum and consolidation. The aggressive drop indicates a potential shift in sentiment.

MACD Analysis

The MACD line is below the Signal line, indicating bearish momentum.

A recent bearish crossover with widening lines suggests increasing downward momentum.

The histogram is in negative territory and expanding downward, confirming strong bearish momentum.

Volume Analysis

A spike in volume accompanies the recent large bearish candle, indicating strong selling activity, possibly involving institutional traders.

High volume on a bearish candle supports the validity of the downward price move.

The significant volume spike reinforces the bearish sentiment and possible continuation of the downtrend.

Support & Resistance

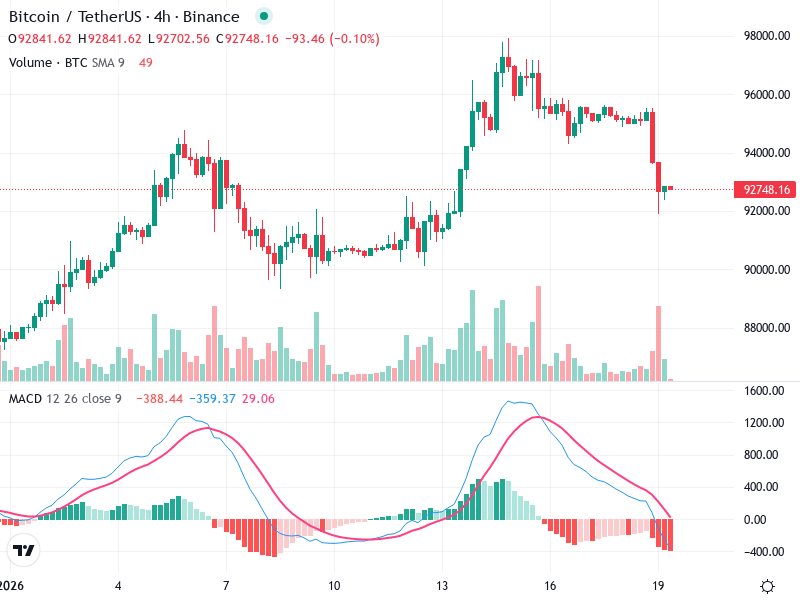
Support: Around 92,000, where the price has shown some buying interest recently.

Resistance: Near 95,00096,000, coinciding with recent highs before the drop.

A close below the 92,000 support may indicate further downside potential, whereas a reversal could see a challenge of 95,000.

Actionable Insights

Sell on retracement: Traders might consider shorting if the price bounces back to resistance levels near 95,000, if confirmed by weak momentum.

Wait for confirmation: Consider waiting for a clear signal, such as a reversal pattern, before taking long positions.

Watch for any bullish reversal patterns near 92,000 to signal potential buying.

The AI Technical Analysis Center is an informational tool only and does not constitute investment or trading advice.
This site is registered on wpml.org as a development site. Switch to a production site key to remove this banner.