Generic selectors
Exact matches only
Search in title
Search in content
Post Type Selectors

Popular stocks

Crypto

CFD

Currencies

Support

Gold

BTC/USD – Technical Analysis – 4h

January 26, 2026 08:05

Quick Summary

The chart is showing potential shifts in market sentiment. Recent technical indicators are signaling a possible reversal in trend. Traders should monitor for confirmations and align strategies accordingly.

Candlestick Analysis

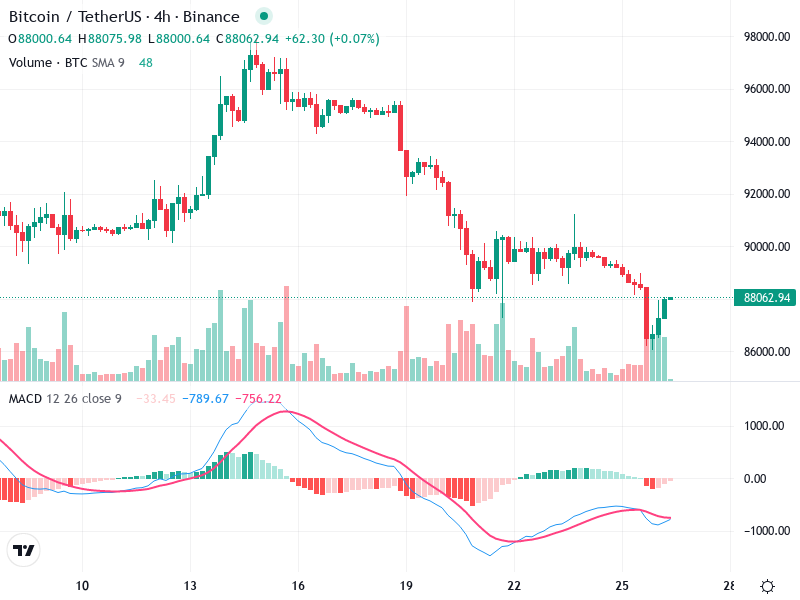
The recent candlesticks show a possible bullish reversal pattern. Notably, a series of smaller body candles leading to a bullish engulfing pattern suggests a potential reversal from the recent downtrend.

The market has been bearish, moving sharply downwards, but the recent formation suggests a possible shift to a bullish sentiment or at least a temporary pullback.

There is a noteworthy pullback zone around the current price level of 88,000, with the potential for a breakout above 88,500 if momentum continues.

MACD Analysis

There is a bullish crossover where the MACD line moves above the Signal line, indicating rising bullish momentum.

The histogram is turning positive, reinforcing the potential for bullish momentum in the short term.

No strong divergence is observed currently, suggesting the price movements are aligned with MACD signals.

Volume Analysis

Significant increase in volume accompanies the recent bullish candles, supporting the potential reversal indicated by the candlestick pattern.

The increase in volume aligns with the potential reversal, providing confirmation that the recent price movements are supported by trading interest.

There is evidence of strong activity, likely indicating interest from larger traders or institutions.

Support & Resistance

A key support level is found around 86,000, where buyers have emerged recently.

Resistance is observed around the 88,500 level, coinciding with recent highs and a potential breakout point.

These levels are crucial for confirming whether the potential reversal holds or fails.

Actionable Insights

Consider a buy position if the price breaks above the 88,500 resistance, confirmed by sustained volume and MACD support.

Consider a sell position if the price fails to hold above the 88,000 level, showing signs of bearish pressure returning.

Maintain position if the price holds stable above support levels, watching for consolidation signals.

The AI Technical Analysis Center is an informational tool only and does not constitute investment or trading advice.
This site is registered on wpml.org as a development site. Switch to a production site key to remove this banner.