Generic selectors
Exact matches only
Search in title
Search in content
Post Type Selectors

Popular stocks

Crypto

CFD

Currencies

Support

Gold

BTC/USD – Technical Analysis – 4h

January 27, 2026 08:04

Quick Summary

The chart for reveals intriguing movements over recent periods.

With observed potential reversals and resistance level testing, insight is drawn from both technical patterns and volume shifts.

The analysis provides a cautiously optimistic perspective with the current trends.

Candlestick Analysis

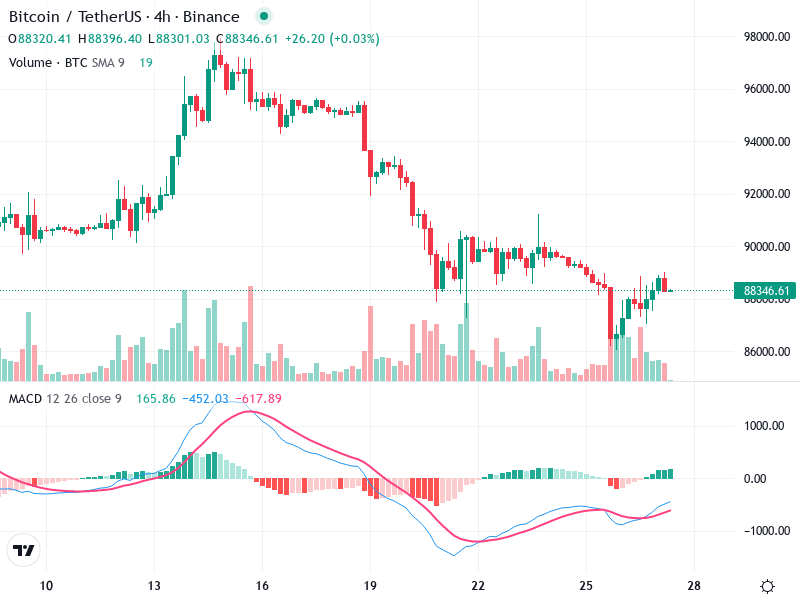
The latest candlestick patterns indicate a possible reversal toward bullish sentiment, with formations resembling a morning star or bullish harami.

Overall, the chart depicts a medium-term bearish trend followed by sideways movement, with hints of potential bullish reversal.

Currently, the price is attempting to break through a key resistance level around 88,500, noted alongside a recent pullback near 86,000.

MACD Analysis

The MACD line crossing above the signal line suggests a bullish crossover and potential momentum shift to the upside.

The MACD histogram's move from negative to positive territory further supports bullish momentum.

No clear divergences are present; the MACD aligns with recent bullish price action.

Volume Analysis

Volume significantly increased during the recent price rise, bolstering the bullish move.

Notable volume spikes indicate potential institutional buying interest during the bottoming formation.

Such volume activity underscores when testing crucial levels in supporting the upward movement.

Support & Resistance

Key support is established around 86,000, corresponding with previous test points.

Immediate resistance is identified at 88,500, with a stronger resistance level near recent highs of 90,000.

These levels serve as crucial indicators for possible breakout or pullback scenarios.

Actionable Insights

Consider buying on a confirmed breakout above 88,500 with increased volume, targeting a short-term move toward 90,000.

Monitor for failure to hold above 88,500, suggesting a potential return to the 86,000 support level.

Watch for confirmation of the bullish reversal, maintained by persistent buying pressure and MACD bullish crossovers.

The AI Technical Analysis Center is an informational tool only and does not constitute investment or trading advice.
This site is registered on wpml.org as a development site. Switch to a production site key to remove this banner.