Generic selectors
Exact matches only
Search in title
Search in content
Post Type Selectors

Popular stocks

Crypto

CFD

Currencies

Support

Gold

BTC/USD – Technical Analysis – 4h

January 30, 2026 08:04

Quick Summary

The Bitcoin /TetherUS chart shows a bearish trend with key technical indicators pointing to potential continued decline. The recent market behavior suggests strong selling pressure, particularly as price movements reflect institutional involvement.

Key levels have been identified for potential support and resistance, urging traders to watch these areas closely for better decision-making.

Candlestick Analysis

Recent formation of a potential hammer on the lower end may indicate a possible reversal after a downtrend. Confirmation is needed with the next few candles.

The current trend is bearish with a series of lower highs and lower lows since the peak observed earlier in the chart.

A key pullback zone is around 84,000, where there was a brief pause before further decline.

MACD Analysis

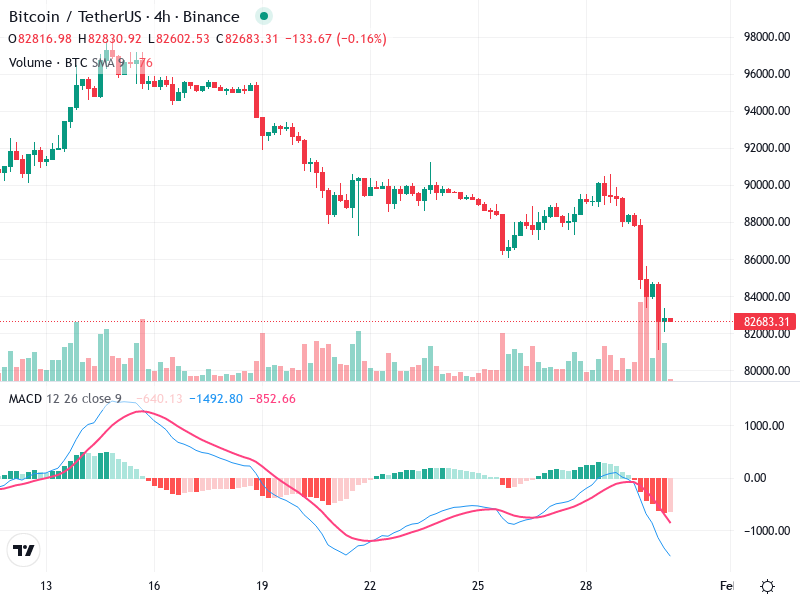
The MACD line is still below the Signal line indicating bearish momentum. No crossover has been observed yet, signaling continued downside pressure.

The histogram shows negative bars, which supports the bearish sentiment, though these bars appear to be slightly contracting, suggesting a possible decrease in bearish momentum.

No significant divergences observed, as both price action and MACD are aligned on the downward trend.

Volume Analysis

There is a noticeable spike in selling volume during the recent decline, reinforcing the bearish trend. The volume spike typically indicates strong selling pressure.

The high volume on down candles suggests strong conviction in the downward move, generally pointing towards institutional involvement.

The overall market volume behavior is supporting the downward trend, making it crucial to monitor any changes closely.

Support & Resistance

Immediate support is around 82,000, where the latest candles appear to stabilize. A breakdown below this level could lead to further declines.

A significant resistance level is around 86,000, where prior consolidation occurred. A move above this level could provide a short-term bullish signal.

These levels will be critical in determining future price action and traders should watch for confirmation before taking positions.

Actionable Insights

Consider shorting if the price breaks below the 82,000 support with continued high volume.

Wait for confirmation of a bullish candle pattern or a bullish MACD crossover to consider any buy positions.

If already short, holding positions may be advisable given the current trend unless a reversal signal is confirmed.

The AI Technical Analysis Center is an informational tool only and does not constitute investment or trading advice.
This site is registered on wpml.org as a development site. Switch to a production site key to remove this banner.