Generic selectors
Exact matches only
Search in title
Search in content
Post Type Selectors

Popular stocks

Crypto

CFD

Currencies

Support

Gold

BTC/USD – Technical Analysis – 4h

February 3, 2026 08:04

Quick Summary

The chart showcases the recent price movements of the asset, indicating potential pivotal zones for traders. The asset’s performance reflects a period of consolidation after a notable decline.

This consolidation phase could signal either a reversal or continuation, making it crucial for traders to observe closely.

Candlestick Analysis

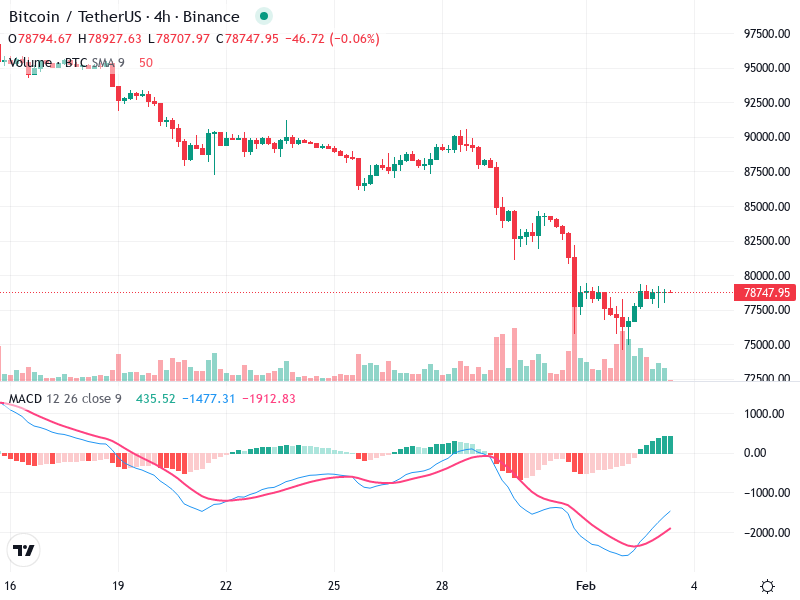
The chart shows a recent bearish trend followed by a sideways consolidation. The price sharply declined from the 87500 zone to around 77500 before stabilizing.

There are no distinct candlestick patterns like a bullish engulfing or doji at the current point, but the consolidation suggests a potential turnaround or continuation.

The current resistance is around 80000, while the support is approximately 77500. The price is in a tight range here.

MACD Analysis

There is a bullish crossover, where the MACD line (blue) has crossed above the Signal line (red), indicating potential bullish momentum.

The MACD histogram is turning positive, supporting the bullish crossover and suggesting increasing bullish momentum.

No clear divergence observed between the MACD and price action at this point.

Volume Analysis

There was a significant increase in volume during the sharp price drop, which has since declined during consolidation.

Decreasing volume during sideways price action may indicate a lack of conviction in either direction.

A previous volume spike during the decline suggests strong selling pressure, possibly by institutional investors.

Support & Resistance

80000 is a key resistance level that, if broken, could indicate a reversal or continuation of bullish momentum.

77500 serves as immediate support, holding this level is crucial to prevent further downside.

Watch for a clear breakout or breakdown from these levels for trading signals.

Actionable Insights

Consider buying if there is a decisive breakout above 80000 with increased volume and confirmation.

Be cautious of breaking below 77500, which could lead to further downside.

Hold positions while price remains between 77500-80000, awaiting clearer trend direction.

The AI Technical Analysis Center is an informational tool only and does not constitute investment or trading advice.
This site is registered on wpml.org as a development site. Switch to a production site key to remove this banner.