Generic selectors
Exact matches only
Search in title
Search in content
Post Type Selectors

Popular stocks

Crypto

CFD

Currencies

Support

Gold

BTC/USD – Technical Analysis – 4h

February 6, 2026 08:04

Quick Summary

The 4-hour chart for Bitcoin /TetherUS reveals a potential shift in trends, with signs of stabilization after a sharp decline. The asset is currently testing critical levels that could dictate its future direction.

The analysis explores various indicators, focusing on the likelihood of a potential reversal and the significant levels to watch.

Candlestick Analysis

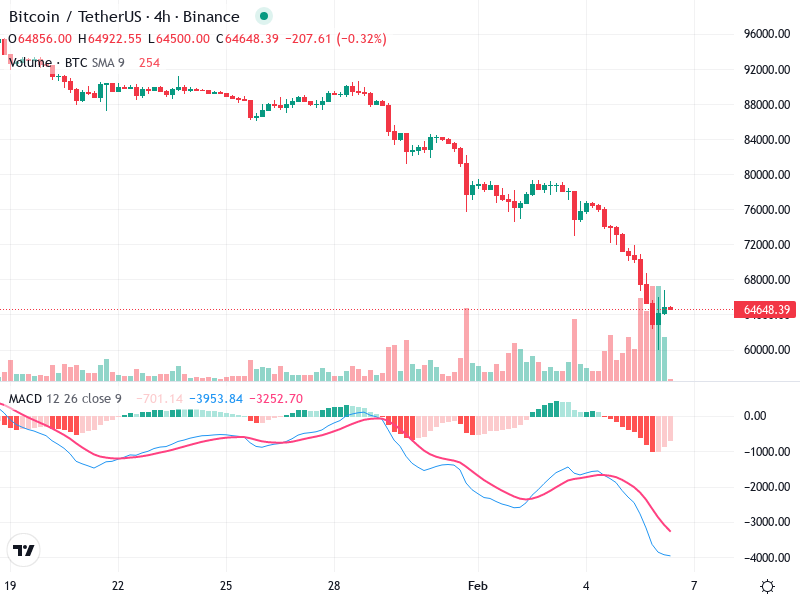
The candlestick chart reveals a potential bullish reversal pattern, characterized by recent candlesticks with long lower wicks, signaling buying pressure.

The overall trend has been sharply bearish, but there are hints of stabilization or possible reversal occurring.

A breakout above the current consolidation zone at 64,648.39 with significant volume could indicate a trend reversal.

MACD Analysis

MACD line is showing recent upward movement towards the Signal line, suggesting a possible impending bullish crossover.

The MACD histogram is decreasing in negative value, indicating weakening bearish momentum.

There is a bullish divergence forming, as the price recorded lower lows without the MACD lines doing the same, hinting at potential upward movement.

Volume Analysis

A visible increase in volume during recent price movements suggests high conviction in the market's current stance.

The rise in volume supports the potential for a trend change, pointing to strong buying at these levels.

The spikes above average volume could indicate institutional activity or heightened interest at present price levels.

Support & Resistance

Recent heavy volume has formed strong support around the 64,000 level.

The price faces immediate resistance at 68,000, a prior support level that has become resistance following the recent downtrend.

Observing these levels could provide valuable insight into upcoming price movements and potential breakouts.

Actionable Insights

Consider a buying strategy if there is a bullish MACD crossover with sustained high volume.

Caution is advised for false breakouts; a drop below the support level could signal a continuation of the bearish trend.

If already holding the asset, watch for volume confirmation to indicate strengthening upward momentum upon a resistance breakout.

The AI Technical Analysis Center is an informational tool only and does not constitute investment or trading advice.
This site is registered on wpml.org as a development site. Switch to a production site key to remove this banner.