Generic selectors
Exact matches only
Search in title
Search in content
Post Type Selectors

Popular stocks

Crypto

CFD

Currencies

Support

Gold

BTC/USD – Technical Analysis – 4h

February 9, 2026 08:04

Quick Summary

The chart for shows dynamic movements with potential signals for traders.

Recent activity suggests a developing trend that requires close observation.

Candlestick Analysis

The initial downtrend with red candlesticks suggests early selling pressure.

Following this, the chart hints at a consolidation phase potentially preparing for a shift.

Recent green candlesticks indicate a possible attempt at a bullish recovery.

MACD Analysis

The MACD line crossing above the Signal line points to a bullish crossover.

The positive histogram further supports the bullish momentum gain.

No significant MACD to price action divergence is currently observed, maintaining bullish interest.

Volume Analysis

Recent rallies have been accompanied by increased volume, strengthening bullish confidence.

A consolidation phase with decreasing volume points to potential market hesitation.

Close monitoring of volume changes is essential for validating market moves.

Support & Resistance

Support is strongly established around the 68,000 level, providing a potential price floor.

Resistance near 72,000 is critical; clearing this would suggest increased bullish sentiment.

Breaking these key levels could define the next direction for the market.

Actionable Insights

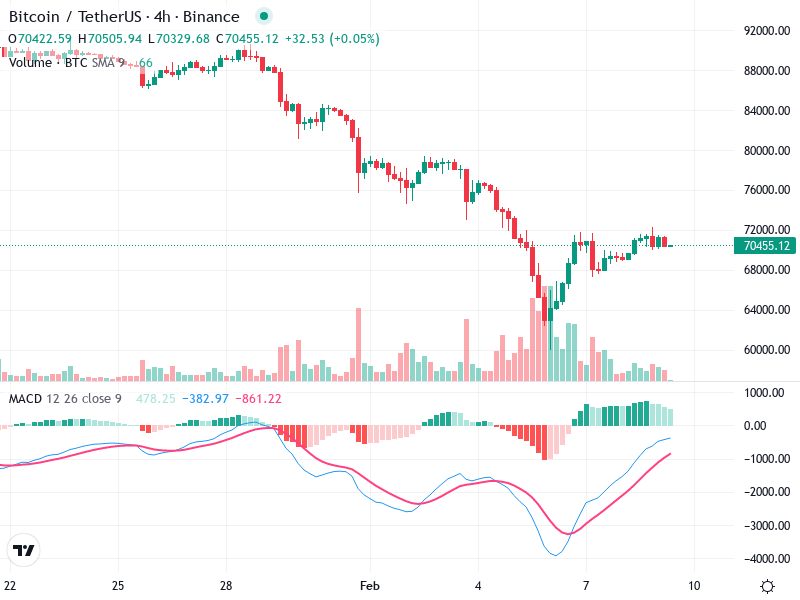
Consider a buy position if a breakout above 72,000 is confirmed with strong volume.

Maintain caution on sell strategies should the price retreat below current highs with rising volume.

Holding is advisable if the price remains between 68,000 and 72,000 with no clear signals.

The AI Technical Analysis Center is an informational tool only and does not constitute investment or trading advice.
This site is registered on wpml.org as a development site. Switch to a production site key to remove this banner.