Generic selectors
Exact matches only
Search in title
Search in content
Post Type Selectors

Popular stocks

Crypto

CFD

Currencies

Support

Gold

BTC/USD – Technical Analysis – 4h

February 19, 2026 08:04

Quick Summary

The chart highlights potential turning points with notable candlestick patterns.

The overall trend suggests consolidation, with critical support and resistance levels in focus.

Market indicators provide mixed signals, suggesting caution in trading decisions.

Candlestick Analysis

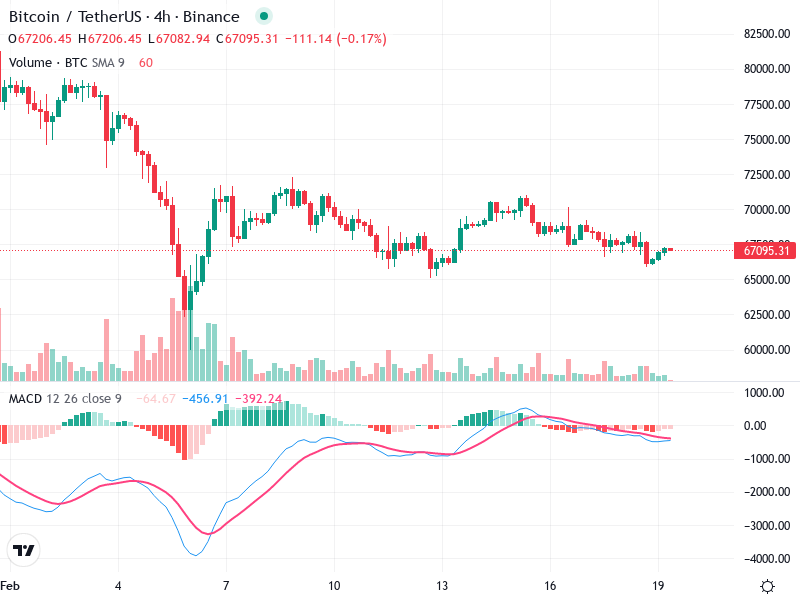
Significant patterns are observed, with potential reversals such as the hammer indicating a bullish reversal in a downtrend.

The overall trend is sideways after a previous downtrend, marking a consolidation phase.

Breakout and pullback zones are identified around 72,500 and 65,000, respectively.

MACD Analysis

The MACD line is below the Signal line, indicating a bearish sentiment, though convergence suggests a potential crossover.

The histogram shows decreasing negative momentum, implying weakening bearish pressure.

No clear divergence between the MACD and price action as both indicate sideways movement.

Volume Analysis

A noticeable spike in volume was observed with the initial price drop, suggesting strong selling pressure.

Decreased volume during sideways movement reflects a lack of strong buying or selling conviction.

Substantial volume increases at trend reversal points may suggest institutional activity, especially near the hammer formation.

Support & Resistance

Support zones are around 65,000, marking previously tested support areas.

Resistance zones are approximately at 72,500, representing recent highs.

Holding support could signal potential for upward movement, while breaking resistance may confirm a bullish reversal.

Actionable Insights

Consider buying if the MACD confirms a bullish crossover with increasing volume, especially if the price breaks above 72,500 resistance.

Watch for a breakdown below 65,000 with increased volume for a potential short opportunity.

Maintain positions if price remains within the consolidation zone with no significant changes in indicators.

The AI Technical Analysis Center is an informational tool only and does not constitute investment or trading advice.
This site is registered on wpml.org as a development site. Switch to a production site key to remove this banner.