Generic selectors
Exact matches only
Search in title
Search in content
Post Type Selectors

Popular stocks

Crypto

CFD

Currencies

Support

Gold

BTC/USD – Technical Analysis – 4h

February 23, 2026 08:04

Quick Summary

The Bitcoin / TetherUS chart reveals significant bearish indicators.

Recent candlestick patterns suggest a downward trend.

Traders should be cautious of potential further declines.

Candlestick Analysis

The chart displays a bearish engulfing pattern recently, indicating potential downside momentum.

A prominent red candle shows a sharp downward move, suggesting strong bearish sentiment at this point.

The trend appears to be bearish in the short term, with a noticeable decline in recent candlestick patterns.

MACD Analysis

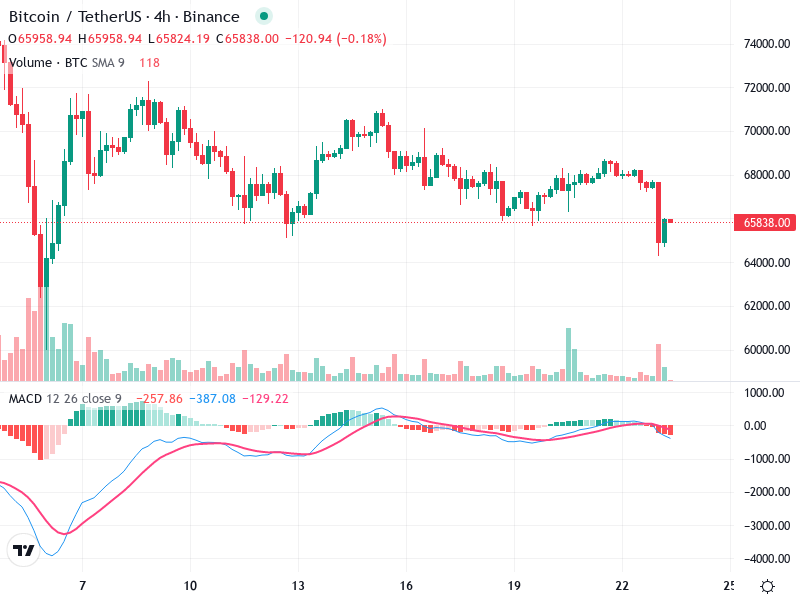
A bearish crossover has occurred, with the MACD line crossing below the Signal line, indicative of increasing bearish momentum.

The histogram displays increasing negative values, reinforcing the bearish momentum.

No significant divergences observed between price action and MACD, aligning with the current downward price action.

Volume Analysis

A significant increase in volume accompanies the recent price drop, highlighting possible institutional selling pressure or panic selling.

The volume spike supports the sharp decline, validating the bearish move.

Note the sharp volume spike with the large red candle, which could suggest significant market activity and sentiment change.

Support & Resistance

Key support around the 64,000 level, where a previous consolidation took place.

Immediate resistance is around the 66,000 level, where the recent pullback failed to break higher.

Monitoring these levels for potential reversals or breakouts is crucial.

Actionable Insights

Consider selling or shorting if the price fails to recover above the resistance level of 66,000 with confirming bearish signals.

A cautious hold is advised if potential support at 64,000 shows strength and MACD starts converging towards a bullish signal.

Confirmation of trend direction with additional volume spikes or neutralization should be closely watched.

The AI Technical Analysis Center is an informational tool only and does not constitute investment or trading advice.
This site is registered on wpml.org as a development site. Switch to a production site key to remove this banner.