Generic selectors
Exact matches only
Search in title
Search in content
Post Type Selectors

Popular stocks

Crypto

CFD

Currencies

Support

Gold

BTC/USD – Technical Analysis – 4h

February 25, 2026 08:04

Quick Summary

The Bitcoin /TetherUS 4-hour chart showcases potential bullish patterns with significant changes signaling a trend reversal.

The asset has shown recent upward momentum following a bullish engulfing pattern.

Current movements are influenced by key support and resistance levels.

Candlestick Analysis

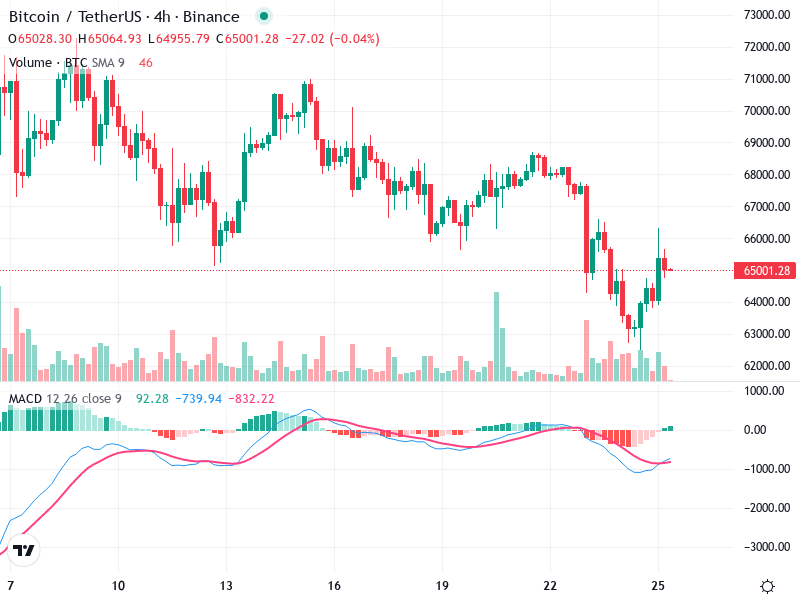
Recently, there's a bullish engulfing pattern, evident by a large green candle completely engulfing a preceding red candle.

The overall trend has been bearish, with a series of lower highs and lower lows observed until the recent bullish engulfing, suggesting a potential trend change or pullback.

The recent move upward from around 64000 could indicate a breakout attempt, while 65000 appears to be a level where price is consolidating.

MACD Analysis

The MACD line is crossing above the Signal line, which is a bullish crossover and often indicates a potential upward momentum.

The histogram shows increasing green bars, suggesting strengthening bullish momentum.

There's no clear divergence between the MACD and the price action as of now; they both suggest recent bullish activity.

Volume Analysis

There is a noticeable increase in volume during the recent price rise, which typically supports the bullish move.

The rise in volume during the price increase indicates strong buying interest, supporting the bullish engulfing pattern.

A significant volume spike occurred during the initial part of the rise, which might suggest institutional buying interest.

Support & Resistance

Key support identified near 64000, which corresponds to the recent low before the bullish move.

Immediate resistance is around 66000, where price has paused; breaching this could lead to further upward movement.

Actionable Insights

If the price holds above 65000 and the MACD continues showing bullish trends, it could be a buying opportunity targeting resistance at 66000 and beyond.

Watch for potential bullish exhaustion around 66000; failure to break above convincingly could present a selling opportunity.

A wait-and-see approach may be appropriate for more conservative traders until a clear trend direction is confirmed.

Look for confirmation of the bullish trend by observing if the price can maintain above the 65000 level with sustained volume.

The AI Technical Analysis Center is an informational tool only and does not constitute investment or trading advice.
This site is registered on wpml.org as a development site. Switch to a production site key to remove this banner.