Generic selectors
Exact matches only
Search in title
Search in content
Post Type Selectors

Popular stocks

Crypto

CFD

Currencies

Support

Gold

BTC/USD – Technical Analysis – 4h

February 26, 2026 08:04

Quick Summary

The recent chart analysis of suggests a potential bullish trend in motion.

The price movements reveal significant shifts, particularly with a noted reversal pattern.

This could signify a promising opportunity for traders looking to capitalize on the market conditions.

Candlestick Analysis

The recent price action shows a bullish reversal. There was a distinct drop followed by a recovery, indicating a potential bottoming out pattern.

A notable bullish engulfing pattern is visible in the recent upward move, confirming a bullish reversal from the previous downtrend.

The price broke through a previous resistance level around 66,700, and there appears to be a pullback to test this as new support.

MACD Analysis

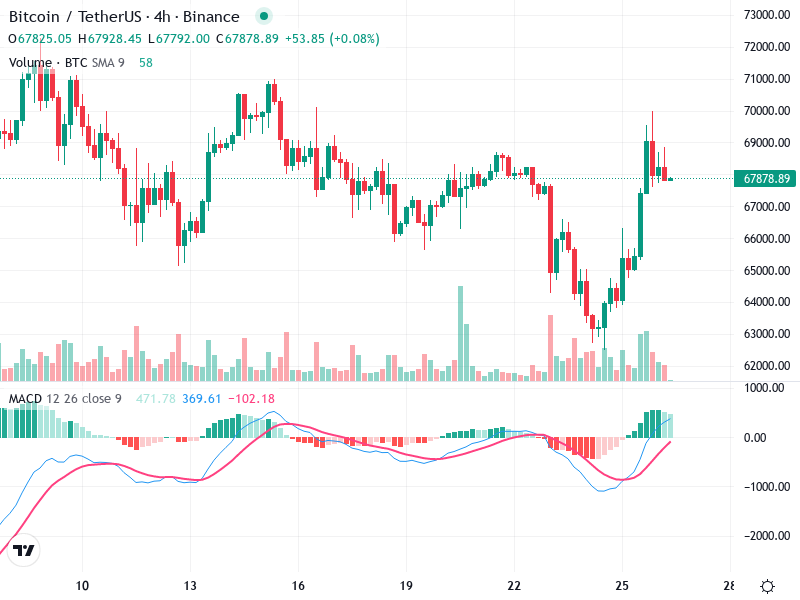
There was a recent bullish crossover, where the MACD line crossed above the Signal line, suggesting upward momentum.

The histogram is positive and expanding, indicating strengthening bullish momentum.

Currently, no significant divergence is noted between the MACD and price action, supporting the upward trend.

Volume Analysis

There was a spike in volume accompanying the price rise, indicating strong buying interest.

The increased volume supports the bullish price movement, suggesting the rally has conviction.

The spike during the breakout hints at likely institutional activity or significant trader interest.

Support & Resistance

The new support level is around 66,700, which was a previous resistance area.

Significant resistance appears near 69,000; a clear breakout over this level could lead to further bullish action.

Monitoring these levels can provide insights into potential future price movements.

Actionable Insights

Consider buying on dips or confirming support at around 66,700 with a stop loss slightly below this level.

A failure to hold above 66,700 could signal a short opportunity with a target near recent lows around 64,500.

Keep an eye on the resistance breakout at 69,000 for confirmation of continued bullish trend.

The AI Technical Analysis Center is an informational tool only and does not constitute investment or trading advice.
This site is registered on wpml.org as a development site. Switch to a production site key to remove this banner.