Generic selectors
Exact matches only
Search in title
Search in content
Post Type Selectors

Popular stocks

Crypto

CFD

Currencies

Support

Gold

BTC/USD – Technical Analysis – 4h

March 5, 2026 08:04

Quick Summary

The chart for shows a recent upward trend characterized by higher highs and higher lows. Significant price movements have been observed with some consolidation.

As approaches a strong resistance level, traders should be vigilant for potential breakout or reversal signals.

Candlestick Analysis

The most recent candlesticks show a strong bullish momentum with a pullback after a sharp rise.

There is no clear reversal pattern such as a bearish engulfing or doji visible at the top, suggesting a potential continuation.

The price is pulling back after approaching the 74,000 resistance level, which could act as a key breakout zone if surpassed.

MACD Analysis

The MACD line is above the Signal line, indicating bullish momentum. However, the lines are converging, suggesting potential weakening of this momentum.

The histogram shows decreasing buying momentum with smaller green bars, indicating a potential consolidation or small reversal.

No clear divergences are observed between the MACD and price action at this point.

Volume Analysis

There was a significant increase in volume during the recent price increase, supporting the bullish move.

However, the volume has decreased during the pullback, which is typical and indicates consolidation rather than reversal.

The prior volume spikes could suggest institutional interest coinciding with the uptrend.

Support & Resistance

Around 74,000 is a significant resistance level where the price recently faced rejection.

Support can be seen around the 68,000 and 66,000 levels, which coincide with previous consolidation zones.

Monitoring these levels is crucial for understanding potential breakout or breakdown scenarios.

Actionable Insights

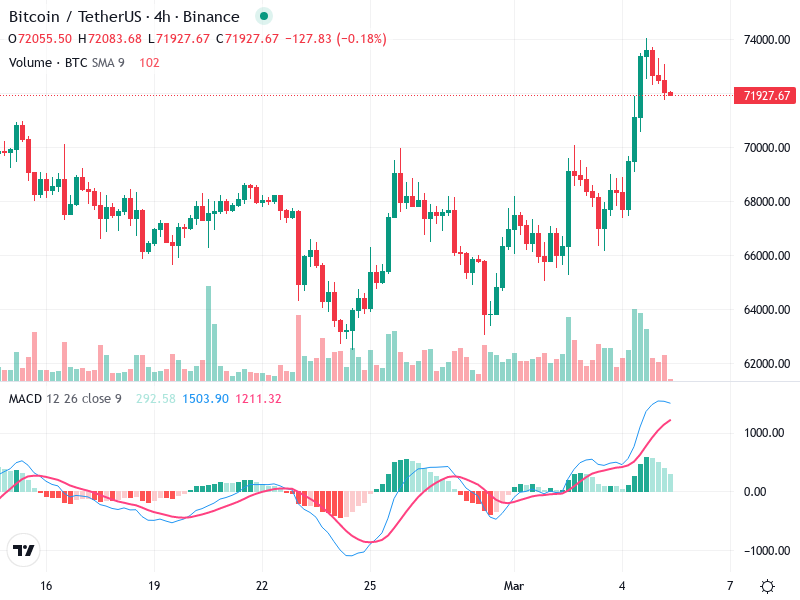
Consider buying if the price consolidates and breaks above 74,000 with increasing volume.

If the MACD signal line crosses below, and the price fails to reclaim 74,000, consider short positions or taking profits.

If holding, monitor for confirmation of direction either through MACD crossover or volume changes.

The AI Technical Analysis Center is an informational tool only and does not constitute investment or trading advice.
This site is registered on wpml.org as a development site. Switch to a production site key to remove this banner.