Generic selectors
Exact matches only
Search in title
Search in content
Post Type Selectors

Popular stocks

Crypto

CFD

Currencies

Support

Gold

BTC/USD – Technical Analysis – 4h

March 6, 2026 08:04

Quick Summary

The analysis of the chart shows recent price action and technical indicators that suggest potential future movements. A significant pullback in the price after a strong upward trend is visible, indicating a potential change in momentum. Various technical indicators further support this analysis.

Candlestick Analysis

A recent bearish engulfing pattern can be observed after a strong upward move, suggesting developing bearish sentiment.

The overall short-term trend appears bullish; however, recent price actions indicate a potential pullback.

The price pulled back after reaching above 72000, suggesting a resistance area.

MACD Analysis

The MACD line crossed below the Signal line, indicating a bearish crossover.

The MACD histogram shows increasing negative values, suggesting growing bearish momentum.

No obvious divergences are present, but the growing histogram might signal strengthening bearish sentiment.

Volume Analysis

A noticeable increase in volume during the recent upswing was followed by reduced volume as prices pulled back, typical of a consolidation phase after a sharp movement.

The higher volume on upward moves supports the bullish move, but decreasing volume during retracement indicates a lack of strong selling pressure.

The absence of volume spikes suggests a lack of strong institutional selling currently.

Support & Resistance

Key resistance is noted around the 72000 level, which has been difficult to break sustainably.

Initial support is around 70000, which could be tested if bearish momentum continues.

Traders need to monitor these levels for potential breakout or breakdown scenarios.

Actionable Insights

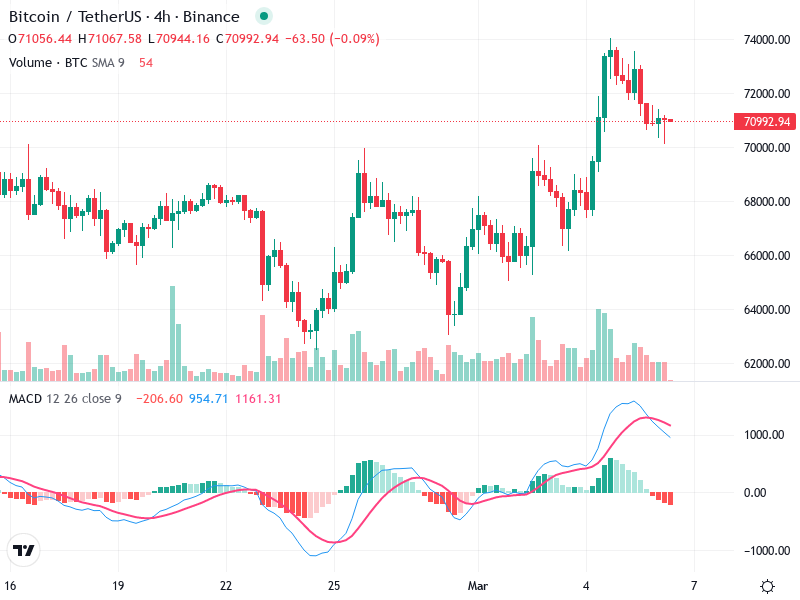
Consider potential buying near the 70000 support, looking for confirmation of reversal signals like bullish candlesticks with increasing volume.

If prices break below the 70000 support with strong volume, consider short positions as a sell strategy.

Monitor until clear signals are observed for confirmation, particularly around reversal patterns or changes in volume near 70000 support.

The AI Technical Analysis Center is an informational tool only and does not constitute investment or trading advice.
This site is registered on wpml.org as a development site. Switch to a production site key to remove this banner.