Generic selectors
Exact matches only
Search in title
Search in content
Post Type Selectors

Popular stocks

Crypto

CFD

Currencies

Support

Gold

BTC/USD – Technical Analysis – 4h

March 9, 2026 08:04

Quick Summary

This analysis focuses on understanding recent movements in the asset’s price chart, with attention paid to candlestick patterns, MACD indicators, and volume changes.

The asset is currently showing signs of a bearish trend, yet potential bullish signals are emerging through certain technical indicators.

Candlestick Analysis

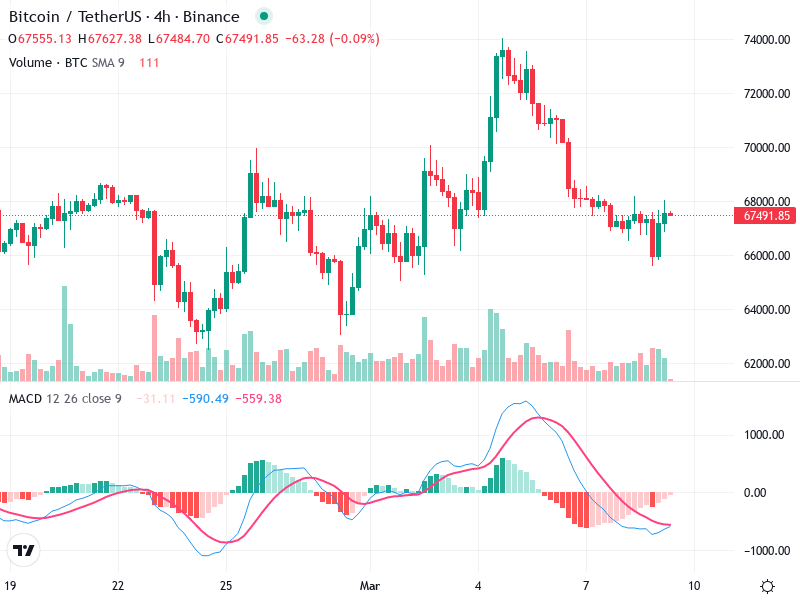
The chart does not display any strong reversal candlestick patterns like bullish engulfing or hammer; however, some small consolidation candlesticks appear, indicating indecision.

There is a clear bearish trend following a peak just under 74,000, followed by a series of lower highs and lower lows.

A support level is forming around 66,000. A breakout above the recent peak around 68,000 may suggest a trend reversal.

MACD Analysis

The MACD line is below the Signal line, indicating bearish momentum. However, both lines are converging, suggesting potential upcoming bullish crossover.

The histogram bars are negative but decreasing in size, indicating a reduction in bearish momentum, which can precede a reversal.

No clear divergence is seen in the price action and MACD.

Volume Analysis

The volume shows spikes during the recent decline, supporting the bearish movement, but volumes decreased during the sideways movement, indicating consolidation.

No unusual volume spikes suggest significant institutional activity at this time.

Overall, volume trends indicate bearish support with moments of market indecision.

Support & Resistance

Support is around 66,000, as multiple candlesticks bounced at this level.

Resistance is near 68,000, where prior consolidation and rejection occurred.

Monitoring these levels is essential for predicting future price movements.

Actionable Insights

Consider entering if there is a confirmed breakout above 68,000 with increased volume and a bullish MACD crossover.

If price breaks below 66,000 with an increase in volume, expect further downside.

If within the 66,000 to 68,000 zone, await further confirmation before making a move.

The AI Technical Analysis Center is an informational tool only and does not constitute investment or trading advice.
This site is registered on wpml.org as a development site. Switch to a production site key to remove this banner.