Generic selectors
Exact matches only
Search in title
Search in content
Post Type Selectors

Popular stocks

Crypto

CFD

Currencies

Support

Gold

BTC/USD – Technical Analysis – 4h

March 12, 2026 08:03

Quick Summary

The chart for demonstrates a state of consolidation with no strong directional bias, as both bullish and bearish elements are present.

Key technical indicators hint at a potential slight bullish trend, but further confirmation is needed to substantiate this.

Candlestick Analysis

The chart presents a mixed trend with both bullish and bearish candlesticks. Recently, there seems to be a consolidation phase with no dominant pattern emerging. A slight bullish inclination is noted as recent candles show higher lows.

Significant candlestick patterns such as bullish engulfing or doji are not prominently visible. However, there are a few hammer-like formations that could indicate potential support.

There are no clear breakout or pullback zones currently; the price is fluctuating within a range.

MACD Analysis

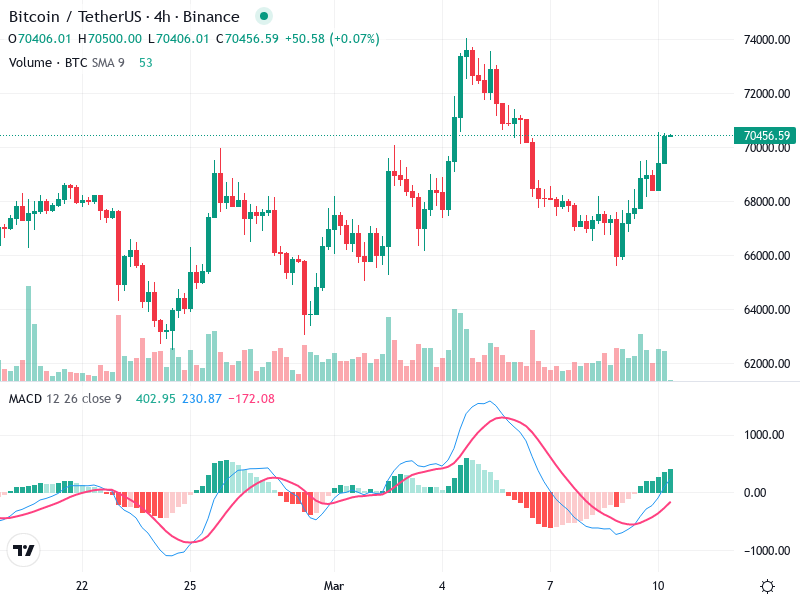
The MACD line is slightly above the Signal line, indicating a recent bullish crossover. This suggests potential upward momentum, albeit weak.

The MACD histogram is close to the zero line, showing minimal momentum. There is a slight bullish tendency, but no strong conviction.

There’s no significant divergence observed between MACD and price action, which means the two are moving in tandem for now.

Volume Analysis

Volume is relatively stable, with no substantial spikes that could indicate strong buying or selling pressure.

The consistency in volume without large deviations suggests balanced interest, where neither buyers nor sellers are dominating.

No unusual spikes suggest limited institutional activity at this moment.

Support & Resistance

A key support level is around the 68000 mark, where prices rebounded previously.

Resistance appears near the 72000 level, where prior attempts to break higher failed.

These levels are crucial for assessing potential reversals or breakouts.

Actionable Insights

Current conditions suggest a 'hold' strategy as the market is consolidating with slight bullish tendencies.

Look for a breakout above 72000 for a potential buy entry, or a breakdown below 68000 for considering a short position.

Watch for increased volume as confirmation of a breakout direction.

The AI Technical Analysis Center is an informational tool only and does not constitute investment or trading advice.
This site is registered on wpml.org as a development site. Switch to a production site key to remove this banner.