Generic selectors
Exact matches only
Search in title
Search in content
Post Type Selectors

Popular stocks

Crypto

CFD

Currencies

Support

Gold

BTC/USD – Technical Analysis – 4h

March 13, 2026 08:03

Quick Summary

The chart provides a comprehensive look into the asset’s recent performance, showing key levels of support and resistance. The asset is exhibiting potential bullish momentum, with indicators supporting this movement. Observers should note the approaching resistance level, crucial for determining further direction.

Candlestick Analysis

The chart shows a potential bullish reversal with the presence of several bullish candlestick formations leading to a recent uptrend.

The price movement has recently transitioned from a bearish correction to a bullish trend, as indicated by higher lows and higher highs.

The current price level is approaching a resistance zone near 72,000. A sustained move above this could indicate a breakout.

MACD Analysis

There is a recent bullish crossover where the MACD line has moved above the Signal line, suggesting potential bullish momentum.

The histogram shows increasing positive values, which indicates strengthening bullish momentum.

No significant divergences are noted between the MACD and price action at this time.

Volume Analysis

There is increased volume accompanying the recent price rise, suggesting stronger buying interest.

Rising volume supports the upward price movement, confirming the short-term bullish trend.

The absence of extreme volume spikes suggests regular trading activity without significant institutional maneuvers.

Support & Resistance

The 72,000 level serves as a key resistance. A break above this resistance could pave the way for further gains.

The 70,000 level provides immediate support followed by more substantial support around 68,000.

Actionable Insights

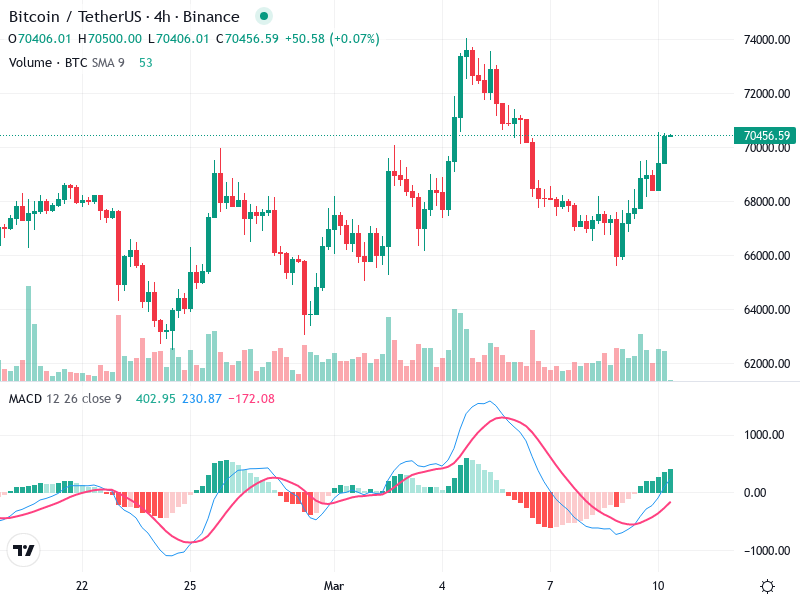
Consideration for buying could be on a confirmed breakout above the 72,000 resistance level, supported by increasing volume.

If the price fails to break above 72,000 and begins to retreat, consider a short-term sell or take-profit position.

Current holders might watch for either a breakout above resistance or a reversal signal for guidance.

The AI Technical Analysis Center is an informational tool only and does not constitute investment or trading advice.
This site is registered on wpml.org as a development site. Switch to a production site key to remove this banner.