Generic selectors
Exact matches only
Search in title
Search in content
Post Type Selectors

Popular stocks

Crypto

CFD

Currencies

Support

Gold

BTC/USD – Technical Analysis – 1D

August 20, 2025 07:43

Quick Summary

The Bitcoin /USDT chart exhibits signs of a potential shift in momentum.

Traders should keep an eye on key indicators for signs of a breakout.

Candlestick Analysis

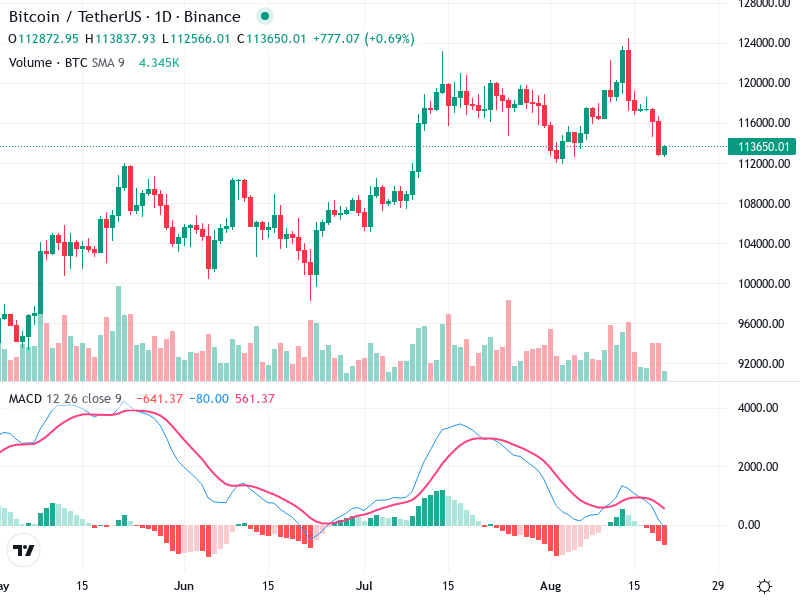
Currently, there appears to be a bearish trend following a recent peak around mid-July.

There is a presence of a bearish engulfing pattern earlier, which suggested the beginning of a downtrend.

Recently, a small doji has appeared near the current price level, indicating indecision and the potential for a reversal or consolidation.

MACD Analysis

The MACD line has crossed below the Signal line, indicating bearish momentum.

The histogram supports a bearish outlook, displaying negative values, but it shows signs of decreasing negative momentum.

No clear divergence is present currently, aligning the MACD with price action.

Volume Analysis

The volume has not shown any significant spikes in alignment with the most recent price moves.

A lack of strong conviction behind the current downtrend is implied.

A sudden increase in volume in the coming days might indicate institutional participation or a stronger move direction.

Support & Resistance

Currently, resistance is around 116,000, which was previously a support level.

Strong support is seen around the 112,000 level, where the price has currently settled.

A breach of this support could lead to a deeper decline.

Actionable Insights

Considering consolidation and indecision, it might be wise to hold for confirmation of the next direction.

A daily close above 116,000 could signal a buy opportunity.

A drop below 112,000 might prompt a sell position.

The AI Technical Analysis Center is an informational tool only and does not constitute investment or trading advice.
This site is registered on wpml.org as a development site. Switch to a production site key to remove this banner.