Generic selectors
Exact matches only
Search in title
Search in content
Post Type Selectors

Popular stocks

Crypto

CFD

Currencies

Support

Gold

BTC/USD – Technical Analysis – 1D

August 21, 2025 07:10

Quick Summary

The stock chart shows recent bearish movements, indicating increasing selling pressure after an earlier uptrend.

Key support and resistance levels are in focus as traders assess potential market reversals.

Candlestick Analysis

The chart demonstrates a recent bearish trend following a previous uptrend. The price has pulled back from recent highs.

There is no clear single candlestick pattern currently dominating, but the overall movement suggests a possible formation of a bearish continuation.

A potential pullback zone is around the 116,000 level where consolidation occurred before the recent decline.

MACD Analysis

The MACD line is below the Signal line, indicating a bearish crossover. This suggests downward momentum.

The histogram is in the negative territory with decreasing momentum, supporting the bearish trend.

There aren’t notable divergences present between MACD and price action, aligning with the declining price.

Volume Analysis

There has been a noticeable decrease in volume recently, which often accompanies price retracements.

The declining volume with falling prices could suggest a lack of strong selling pressure, possibly limiting the downside.

No significant spikes suggest institutional activity. Volume is consistent with prior price trends.

Support & Resistance

The previous support is around 112,000, which should be monitored for potential bounce opportunities.

A significant resistance level is at 116,000, which was tested recently. Any attempts to break above could face challenges.

Actionable Insights

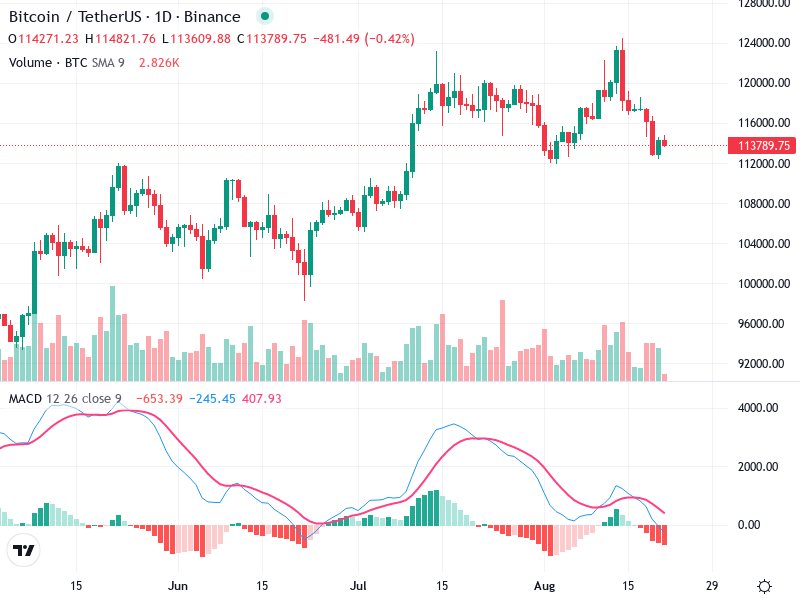
Current market conditions suggest caution; monitor for a potential bullish reversal signal before initiating new positions.

Signs of reversal at 112,000 support. A bullish candlestick pattern or increased volume could signal a buying opportunity.

If the price breaks below 112,000 with volume, it could confirm a further downside.

The AI Technical Analysis Center is an informational tool only and does not constitute investment or trading advice.
This site is registered on wpml.org as a development site. Switch to a production site key to remove this banner.