Generic selectors
Exact matches only
Search in title
Search in content
Post Type Selectors

Popular stocks

Crypto

CFD

Currencies

Support

Gold

BTC/USD – Technical Analysis – 4h

August 22, 2025 07:11

Quick Summary

The chart shows a potential shift in momentum, indicated by several key technical factors. Recent patterns hint at a possible reversal or continuation of the current trend. Observing the interplay between volume and price levels is essential for anticipating future moves.

The short-term outlook appears to be cautiously optimistic, with traders closely monitoring for bullish signals to confirm future direction.

Candlestick Analysis

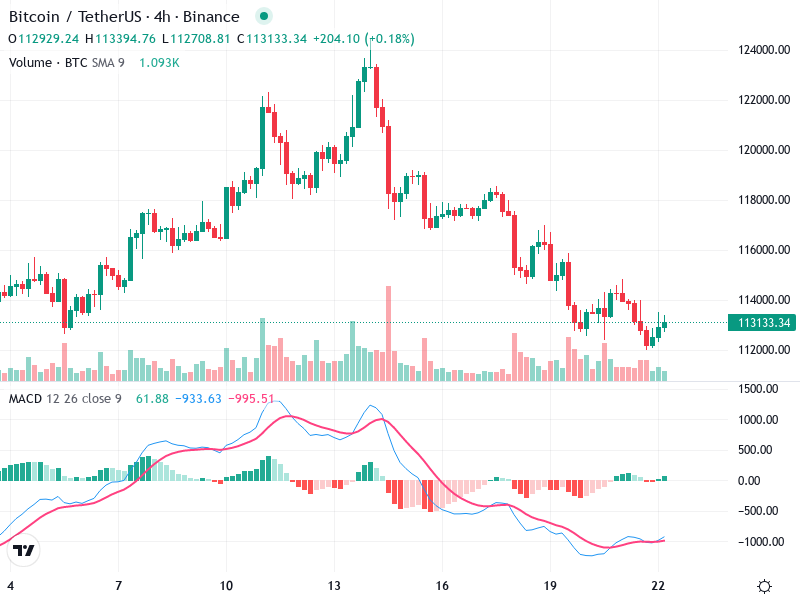
Recently, there is a potential bullish reversal pattern forming, indicated by small-bodied candlesticks at the bottom of the downward trend. This could be a harbinger of a potential reversal or sideways movement.

The trend has been bearish from the peak towards the left, with a potential consolidation phase occurring in recent candles.

A breakout zone could be identified slightly above the recent highs around 114,000 for confirming bullish momentum. The recent low around 112,000 acts as a support zone for potential pullbacks.

MACD Analysis

The MACD line is moving upwards, converging with the signal line, suggesting a potential bullish crossover.

There is a loss in negative momentum as seen by the shrinking of the red bars, which might hint at a reversal or the beginning of an upward trend.

There are no noticeable divergences visible at this point between MACD and price action.

Volume Analysis

Volume has been relatively steady with some increase during the recent consolidation, indicating interest in these price levels.

The consistent volume with a lack of significant spikes suggests that traders are waiting for a confirmation of the reversal.

No recent unusual volume spikes suggest the absence of institutional activity currently.

Support & Resistance

Support: Around 112,000 – Price has rebounded from this level.

Resistance: Around 114,000 – This acts as an overhead resistance for the short-term trend.

Breaching these levels with volume support could indicate a stronger directional move.

Actionable Insights

Consider a buying opportunity if there is a confirmed bullish crossover in MACD and the price breaks above 114,000 with increased volume.

Selling or shorting could be considered if the price falls below the support level of 112,000 convincingly.

Holding is advisable until a clear directional signal is evident.

The AI Technical Analysis Center is an informational tool only and does not constitute investment or trading advice.
This site is registered on wpml.org as a development site. Switch to a production site key to remove this banner.