Generic selectors
Exact matches only
Search in title
Search in content
Post Type Selectors

Popular stocks

Crypto

CFD

Currencies

Support

Gold

BTC/USD – Technical Analysis – 4h

January 21, 2026 08:04

Quick Summary

The BTC/USDT chart reveals a strong bearish trend. Recent market movements show lower highs and lows, indicating a sustained downturn. Candlestick patterns and volume changes suggest potential opportunities and areas of caution.

Candlestick Analysis

The overall trend appears bearish, as indicated by a series of lower highs and lower lows.

A notable bearish engulfing pattern is visible around the 97,000 price level, signaling a strong reversal from the previous uptrend.

A doji-like candlestick is observed near the current level, suggesting market indecision and potential for reversal.

MACD Analysis

The MACD line is below the Signal line, indicating a bearish crossover supporting the recent downtrend.

The histogram is in negative territory but shows signs of narrowing, possibly signaling a weakening of downward momentum.

No significant divergences are observed between the MACD and price action.

Volume Analysis

A noticeable increase in volume accompanies the most recent price drop, supporting the validity and strength of the bearish move.

The pronounced volume spikes suggest possible institutional selling.

Overall volume supports the price movement; no contradiction is observed.

Support & Resistance

The immediate support can be seen around the 88,000 level, which needs to hold to avoid further declines.

Strong resistance at the 90,000-91,000 level where previous support existed; overcoming this level might indicate bullish sentiment returning.

These levels are critical for potential trend reversals.

Actionable Insights

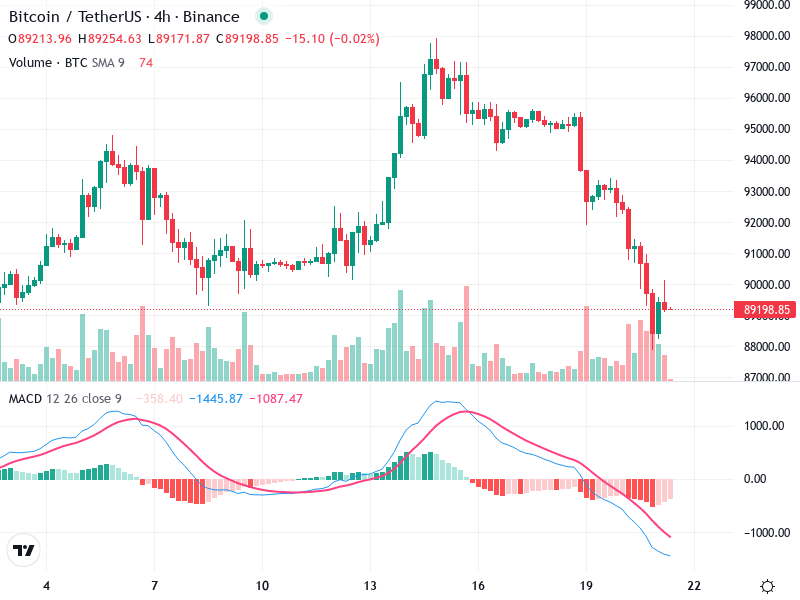
Consider buying if the price forms a reversal pattern above the 88,000 level with supportive volume.

A break below 88,000 with confirming volume signals a potential continuation of the downtrend, providing a selling opportunity.

Due to current indecision near the support level, a hold approach is advised unless a strong reversal signal emerges.

The AI Technical Analysis Center is an informational tool only and does not constitute investment or trading advice.
This site is registered on wpml.org as a development site. Switch to a production site key to remove this banner.