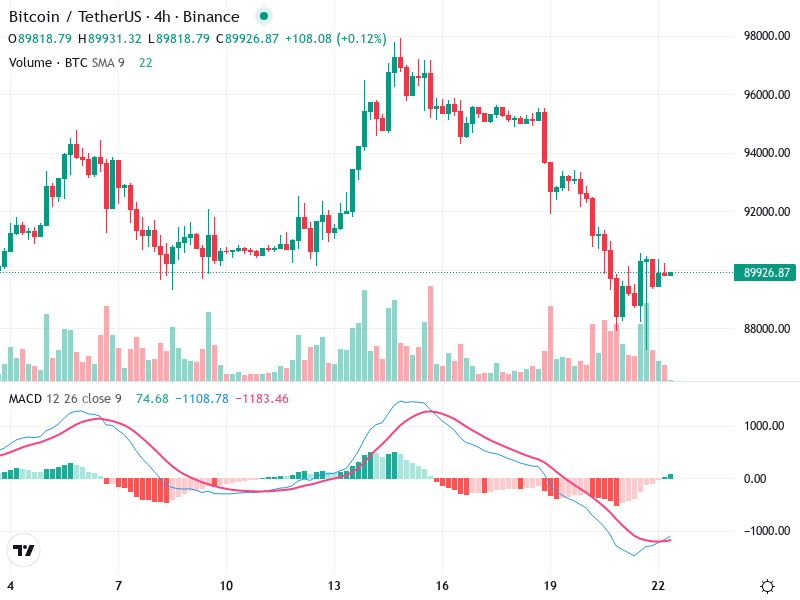
The BTC/USDT 4H chart shows fascinating movements indicating potential changes. The asset demonstrates signs of a possible bullish reversal, with key levels being pivotal for further movement. Market participants are keenly observing these technical indicators to confirm a sustained directional shift.
Candlestick Analysis
Recently, a bullish engulfing pattern has appeared, suggesting a potential bullish reversal.
There are a few doji candles indicating market indecision, especially around the current consolidation phase.
The overall trend appears to be bearish but with recent signs of a potential reversal or sideways movement.
MACD Analysis
The MACD line is crossing above the Signal line, forming a bullish crossover.
The histogram shows decreasing bearish momentum, corroborating the bullish crossover, suggesting a potential gain in upward momentum.
No significant divergence observed currently between MACD and price action.
Volume Analysis
There was a notable increase in volume during the recent bullish engulfing pattern, suggesting stronger conviction by buyers.
Increasing volume with rising price supports the potential bullish reversal, providing stronger validation.
Past unusual spikes could suggest prior institutional buying, especially around the bottom formation.
Support & Resistance
Key support zone is around 88,800, which has been tested and held.
Immediate resistance level is observed around 92,000, aligning with prior consolidation breakout points.
These levels are crucial for monitoring potential price movements.
Actionable Insights
Consider buying if the price holds above the key support and confirms strength with increased volume.
Be cautious if price fails to break above 92,000 with conviction; it could be a sign of sideways or further downward movement.
Holding for confirmation past the resistance with sustained volume may be wise for less aggressive traders.
The AI Technical Analysis Center is an informational tool only and does not constitute investment or trading advice.