Generic selectors
Exact matches only
Search in title
Search in content
Post Type Selectors

Popular stocks

Crypto

CFD

Currencies

Support

Gold

BTC/USD – Technical Analysis – 4h

January 23, 2026 08:05

Quick Summary

The chart currently shows significant levels of support and resistance. Moving between the key levels suggests market indecision.

Trading volumes and MACD indicators offer insights into potential price directions.

Candlestick Analysis

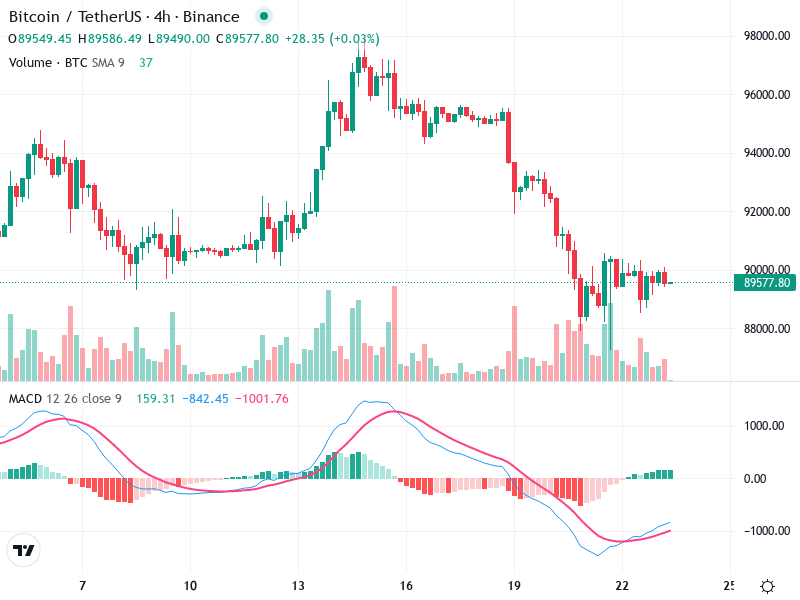
The recent candles indicate a potential consolidation phase, suggesting indecision around the 89,500 level.

No clear reversal patterns like bullish engulfing or hammer are evident, but the small-bodied candles could imply a pause before a potential continuation or reversal.

The trend appears bearish from the peak near 98,000, followed by a decline towards 88,000. There is a slight attempt at recovery, but it's currently moving sideways.

MACD Analysis

The MACD line is approaching the Signal line from below, indicating a potential bullish crossover.

If this crossover occurs, it may suggest a strengthening bullish momentum.

The histogram is currently moving towards positive territory, showing increasing bullish momentum, but it has not yet crossed into positive.

Volume Analysis

Volume has decreased following the initial decline from the peak, indicating reduced selling pressure.

There was a slight increase in volume coinciding with attempts to recover, supporting the idea of potential buying interest at lower levels.

The low volume could suggest that the current sideways movement might lack the strength to break out decisively without increased activity.

Support & Resistance

Key support is around 88,000, recently tested multiple times.

Key resistance is near 91,000, noted where prior rallies halted.

These levels are critical; a break above resistance or below support could set the tone for the next major move.

Actionable Insights

Consider watching for a MACD crossover for a potential buy signal.

A break above 91,000 with increased volume might confirm a bullish move.

Conversely, a drop below 88,000 could signal further downside.

The AI Technical Analysis Center is an informational tool only and does not constitute investment or trading advice.
This site is registered on wpml.org as a development site. Switch to a production site key to remove this banner.