Generic selectors
Exact matches only
Search in title
Search in content
Post Type Selectors

Popular stocks

Crypto

CFD

Currencies

Support

Gold

BTC/USD – Technical Analysis – 4h

January 29, 2026 08:05

Quick Summary

The Bitcoin /TetherUS 4-hour chart showcases significant bearish momentum with potential key support and resistance levels identified.

Recent candlestick patterns and MACD analysis indicate a continuation of the bearish trend.

Volume analysis supports this trend with notable spikes during sell-offs.

Candlestick Analysis

The chart shows a series of small-bodied candlesticks followed by a larger red candlestick, indicating bearish momentum.

A small green candlestick attempted a recovery but was quickly followed by another red one, emphasizing bearish control.

The overall trend remains bearish with some sideways movement in the consolidation phase.

MACD Analysis

The MACD line is below the Signal line, highlighting ongoing bearish momentum.

A recent bearish crossover has occurred as the MACD line crossed below the Signal line.

The histogram is expanding in negative territory, suggesting increasing bearish momentum.

Volume Analysis

There was a noticeable increase in volume during the recent sell-off.

Volume spikes corresponded with price drops, reinforcing the bearish sentiment.

Higher volume on downtrends indicates strong selling pressure, possibly from institutional involvement.

Support & Resistance

Strong support is identified around the 86,000 level where previous consolidation occurred.

Resistance is noted at approximately 90,000 due to rejections in upward price movements.

Recent support appears around the 88,000 level, suggesting a key area of consolidation.

Actionable Insights

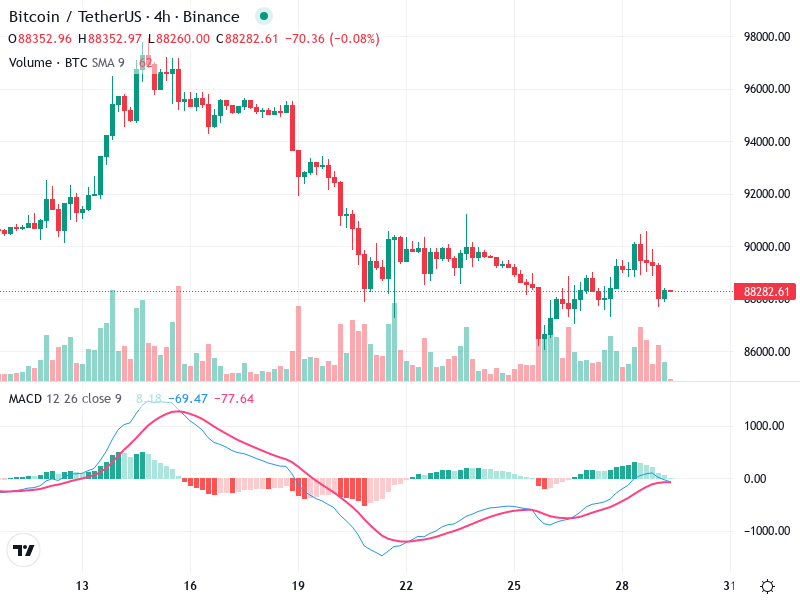
If price breaks below 86,000 with volume confirmation, it could trigger additional selling opportunities.

Traders should watch for candlestick reversal patterns or a bullish crossover in the MACD as potential buy signals.

A sudden breakout above 90,000 could negate the current bearish outlook, indicating potential risks.

The AI Technical Analysis Center is an informational tool only and does not constitute investment or trading advice.
This site is registered on wpml.org as a development site. Switch to a production site key to remove this banner.