Generic selectors
Exact matches only
Search in title
Search in content
Post Type Selectors

Popular stocks

Crypto

CFD

Currencies

Support

Gold

BTC/USD – Technical Analysis – 4h

February 2, 2026 08:04

Quick Summary

The asset is currently exhibiting bearish tendencies based on recent chart patterns. Detailed examination of specific technical indicators suggests potential shifts in momentum.

Close attention is needed on key resistance and support levels as they may define significant price movements.

Candlestick Analysis

The overall trend is bearish, as indicated by a series of lower highs and lower lows.

There is a hammer-like candlestick pattern noticeable, suggesting a potential reversal or at least a pause in the downward momentum.

A potential breakout could occur if the price moves convincingly above the most recent highs around 77,500.

MACD Analysis

The MACD line is below the Signal line, indicating a current bearish phase. However, the gap is narrowing, hinting at a potential bullish crossover.

The histogram bars are shortening, suggesting that bearish momentum is weakening.

There is no clear divergence between the MACD and price action at the moment.

Volume Analysis

There was a significant spike in volume during the latest sell-off, suggesting strong bearish sentiment or possible institutional selling.

Despite high volume, the recent stabilization in price may indicate absorption, where large buyers are counteracting selling pressure.

The volume trends highlight the current sentiment in the market, supporting the bearish analysis.

Support & Resistance

Key support is around 75,000, as indicated by past price reactions.

Immediate resistance is near 77,500, which needs to be broken for further upward movement.

These levels are critical to observe as they could trigger significant market actions.

Actionable Insights

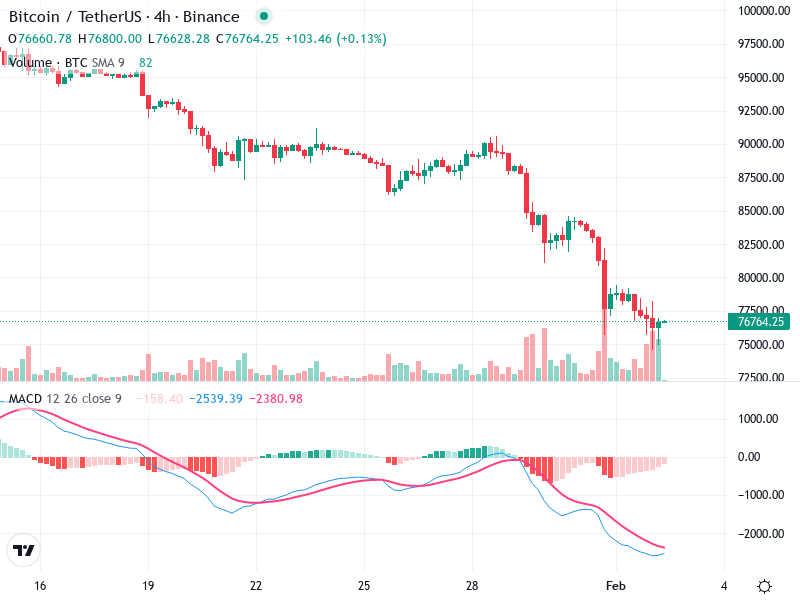
Consider entering if a bullish candlestick pattern confirms above 77,500 with strong volume, indicating a potential trend reversal.

Watch for bearish candlestick patterns, especially near resistance levels, with a potential target around 75,000.

Traders should consider holding if the price consolidates between 75,000 and 77,500, awaiting clear direction signals.

The AI Technical Analysis Center is an informational tool only and does not constitute investment or trading advice.
This site is registered on wpml.org as a development site. Switch to a production site key to remove this banner.