Generic selectors
Exact matches only
Search in title
Search in content
Post Type Selectors

Popular stocks

Crypto

CFD

Currencies

Support

Gold

BTC/USD – Technical Analysis – 4h

February 4, 2026 08:05

Quick Summary

The BTC/USDT chart shows signs of potential trend reversal with key levels to watch. The asset’s current movements could offer opportunities for traders.

Analyzing the candlestick patterns and volume spikes can guide informed decision-making.

Candlestick Analysis

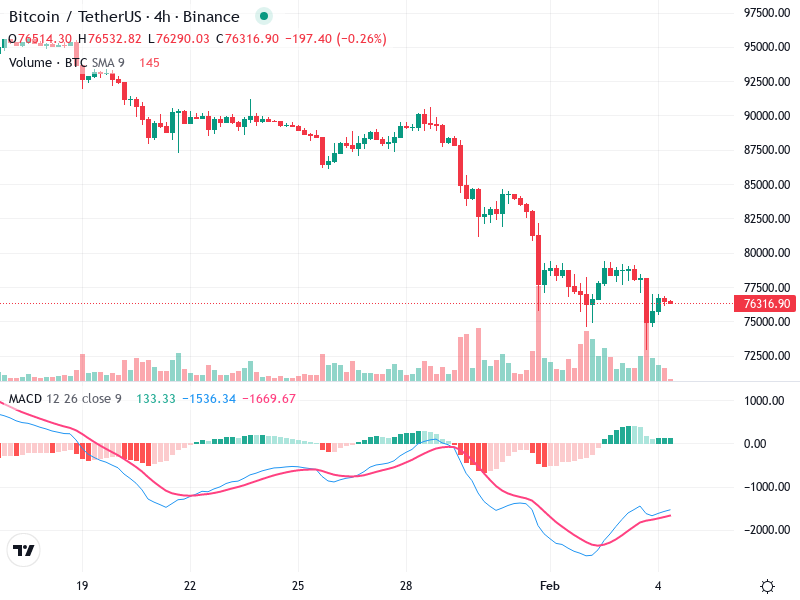
Recently, there appears to be a formation suggesting potential reversal characteristics. Notably, the presence of a long wick on the lower side might indicate a bullish hammer, suggesting buying pressure.

Prior to this, the trend was predominantly bearish with several consecutive red candles.

The overall trend in the short term appears to have shifted from bearish to potential consolidation, with some signs of recovery.

MACD Analysis

The MACD line is currently above the Signal line, suggesting a recent bullish crossover. This is typically a sign of increasing bullish momentum.

The histogram bars are in positive territory and gradually increasing, indicating strengthening bullish momentum.

There seems to be some bullish divergence occurring, as the price makes lower lows while the MACD line trends upward.

Volume Analysis

There is a noticeable spike in volume accompanying the recent bullish candlestick pattern, which supports the buying interest and potential trend reversal.

The volume supports the recent price uptick, indicating that the move may have strength behind it.

The spike in volume during the price consolidation zone suggests potential institutional interest around the support levels.

Support & Resistance

Around the 73,000 level, as evidenced by prior low points and recent buying interest.

A key area to watch for a breakout is around the 77,500 level.

If the price breaks past the immediate resistance, it could potentially reach 80,000.

Actionable Insights

Consider entering long positions if the price maintains above the 75,000 level with continued strong volume and MACD bullish momentum.

Watch for any bearish candlestick patterns forming at the resistance level around 77,500 to take profits.

If currently holding, monitor for a confirmed breakout above 77,500 for continuation of an upward move.

The AI Technical Analysis Center is an informational tool only and does not constitute investment or trading advice.
This site is registered on wpml.org as a development site. Switch to a production site key to remove this banner.