Generic selectors
Exact matches only
Search in title
Search in content
Post Type Selectors

Popular stocks

Crypto

CFD

Currencies

Support

Gold

BTC/USD – Technical Analysis – 4h

February 10, 2026 08:05

Quick Summary

The analysis for reveals several key insights into its chart behavior. The asset appears to be in a consolidation phase following a period of significant price action.

Investors should be alert to potential breakout or breakdown scenarios that might arise from the current chart setup.

Candlestick Analysis

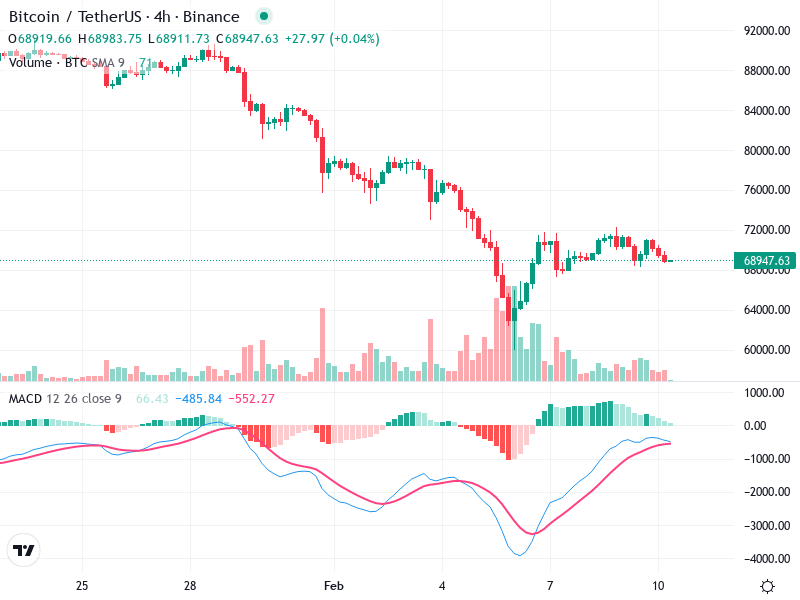
The chart indicates a previous strong bearish trend followed by a sideways consolidation phase. The price has moved from a steep decline to a level where it is stabilizing.

A potential reversal or consolidation pattern is forming after the sharp decline, although no strong reversal candlesticks (like a hammer or bullish engulfing) are immediately visible.

The current consolidation around the 69,000 level could suggest a possibility for a breakout. Watch for movement above 72,000 or below 68,000 for potential breakout or breakdown.

MACD Analysis

The MACD line is converging towards the Signal line, possibly indicating a weakening bullish momentum.

The histogram bars are fading, suggesting a decrease in bullish momentum and the potential for a bearish crossover.

There is no clear divergence between MACD and price action at the moment, but a close watch is advised for upcoming movements.

Volume Analysis

There was a notable volume increase during the recent decline, suggesting strong selling pressure. Current volume levels have decreased, aligning with the consolidation phase.

The reduced volume during the sideways movement suggests a lack of conviction among traders, which is typical in consolidation phases.

No recent unusual volume spikes, indicating no major institutional action currently.

Support & Resistance

Key support is at approximately 68,000, which is crucial as it aligns with the consolidation zone.

Strong resistance is around 72,000, a level that needs to be cleared convincingly for any bullish continuation.

Actionable Insights

Consider buying if the price breaks above 72,000 with increased volume and a confirmation of a bullish crossover on MACD.

Selling or shorting could be considered if the price breaks below the 68,000 support, especially if accompanied by increased bearish volume.

If the price remains within the established range without significant volume changes, a hold strategy is advisable while monitoring for breakout signals.

The AI Technical Analysis Center is an informational tool only and does not constitute investment or trading advice.
This site is registered on wpml.org as a development site. Switch to a production site key to remove this banner.