Generic selectors
Exact matches only
Search in title
Search in content
Post Type Selectors

Popular stocks

Crypto

CFD

Currencies

Support

Gold

BTC/USD – Technical Analysis – 4h

February 18, 2026 08:04

Quick Summary

The Bitcoin /TetherUS chart on a 4-hour timeframe shows significant consolidation. The market is in a neutral phase with identified support and resistance levels.

Current indicators suggest potential bullish or bearish setups depending on future breakout or breakdown scenarios.

Candlestick Analysis

The chart displays a period of consolidation with small-bodied candles indicating indecision.

The chart shows a transition from a bearish trend to a more sideways movement, suggesting a temporary relief from the prior downswing.

The price seems to be stabilizing around the 68,000 level, which could act as a minor breakout zone if broken with strong momentum.

MACD Analysis

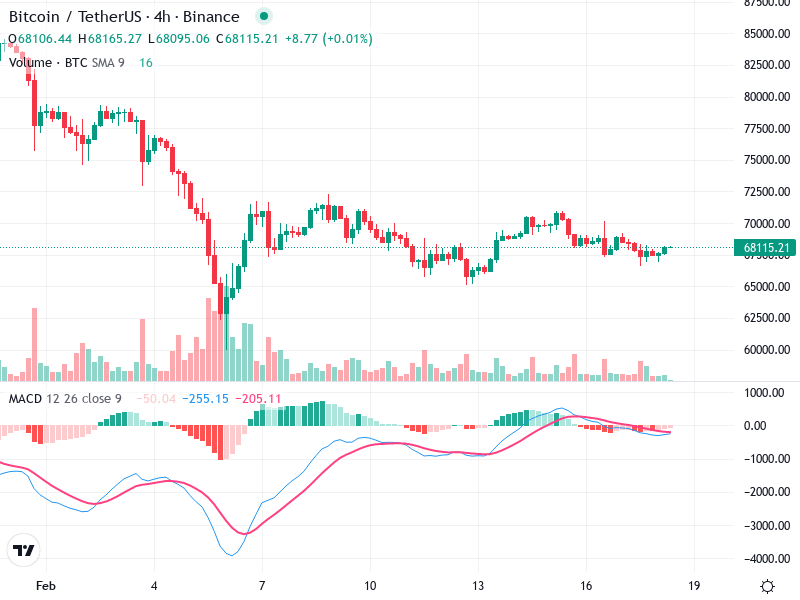
Currently, the MACD line (blue) is close to the Signal line (red) without a clear crossover, suggesting a lack of strong momentum in either direction.

The histogram shows decreasing bearish momentum, trending towards the zero line, indicating potential stabilization or a minor bullish turn.

No significant divergences between the MACD and price action are evident, supporting the current sideways trend.

Volume Analysis

Volume has decreased compared to earlier peaks, reflecting reduced trading activity during this consolidation phase.

The low volume supports the sideways movement, as there is insufficient volume to drive a breakout.

No recent unusual spikes in volume suggest that institutional activity is currently absent.

Support & Resistance

The 65,000 level appears to be a strong support, which is pivotal for avoiding further downtrends.

Resistance is visible around the 70,000 level, marking a potential zone where bullish momentum could face challenges.

Actionable Insights

Consider buying on a confirmed breakout above the 70,000 resistance level with increased volume as confirmation.

Watch for a breakdown below the 65,000 support level, which might indicate continued bearishness.

If price continues to stabilize between the support and resistance with low volume, a wait-and-watch strategy could be advisable.

The AI Technical Analysis Center is an informational tool only and does not constitute investment or trading advice.
This site is registered on wpml.org as a development site. Switch to a production site key to remove this banner.