Generic selectors
Exact matches only
Search in title
Search in content
Post Type Selectors

Popular stocks

Crypto

CFD

Currencies

Support

Gold

BTC/USD – Technical Analysis – 4h

February 20, 2026 08:04

Quick Summary

The asset shows a slight bullish trend after a period of consolidation, hovering near critical levels. Recent sessions have been marked by indecision, indicating a potential for continuation rather than immediate reversal. Watchers of this asset should keep an eye out for breakout opportunities.

Candlestick Analysis

The chart shows a slight bullish trend in recent sessions after a period of consolidation.

There are no clear significant patterns such as bullish engulfing or hammer in recent candles, indicating indecision and potential for continuation rather than immediate reversal.

A breakout above the 68,000 level could signify a stronger bullish move, while a dip below 66,000 might indicate further bearish pressures.

MACD Analysis

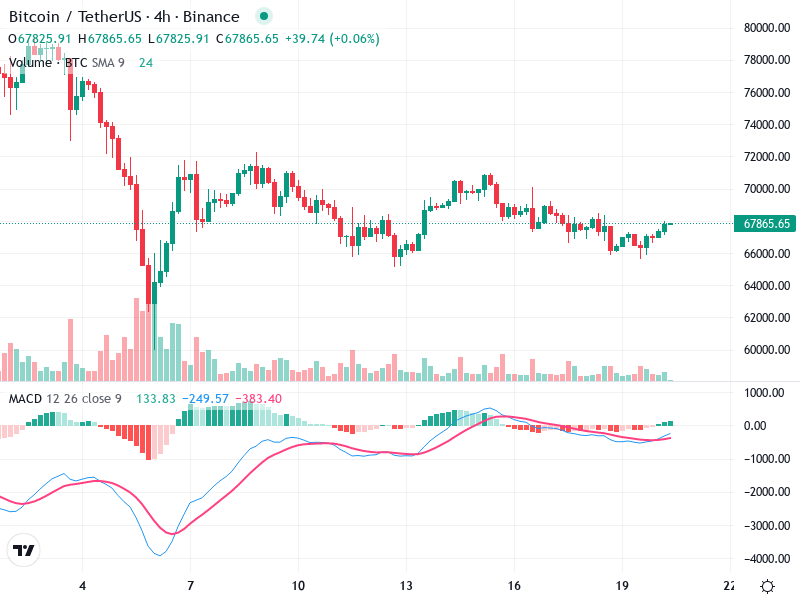
The MACD line is above the Signal line, suggesting bullish momentum. The lines are relatively close, indicating cautious optimism.

The MACD histogram has turned positive, further confirming bullish momentum, but the lack of strong divergence suggests momentum is not overly strong.

There are no clear divergences between the MACD and the price action, which suggests that the current price movements are relatively balanced with market expectations.

Volume Analysis

There are no sharp spikes in volume, which may indicate a lack of strong conviction in either direction. Volume is slightly higher on recent green candles, supporting the modest upward move.

No significant volume spikes indicating institutional activity, suggesting that current movements are likely retail-driven.

Volume analysis indicates cautious optimism without strong conviction in either direction.

Support & Resistance

Resistance around 68,000 acts as a current resistance level. Breaking above this could result in further upward momentum.

The 66,000 level provides immediate support; a breach below this could lead to further declines.

Keeping an eye on these levels is critical for anticipating potential breakouts or breakdowns.

Actionable Insights

Consider buying above the 68,000 breakout with confirmation of increased volume.

Consider selling if the price fails to hold above the 66,000 support level.

It may be prudent to hold if the price remains between the 66,000 to 68,000 range without clear directional bias.

The AI Technical Analysis Center is an informational tool only and does not constitute investment or trading advice.
This site is registered on wpml.org as a development site. Switch to a production site key to remove this banner.