Generic selectors
Exact matches only
Search in title
Search in content
Post Type Selectors

Popular stocks

Crypto

CFD

Currencies

Support

Gold

BTC/USD – Technical Analysis – 4h

February 27, 2026 08:04

Quick Summary

The 4-hour chart for Bitcoin /TetherUS reveals significant trends and patterns. There is a noticeable bullish recovery from a recent support level, suggesting an optimistic outlook. Key resistance around 68,000 could determine further price movements.

Candlestick Analysis

A notable candlestick pattern is a bullish engulfing observed at the recent local bottom, which typically suggests a potential reversal to the upside.

The recent trend appears to be bullish following a recovery from a lower support level. The price action has shifted from a bearish trend to a more sideways/bullish consolidation.

Around 68,000 appears to be a potential breakout zone. Recent price action has attempted consolidation just below this level.

MACD Analysis

The MACD line (blue) recently crossed above the Signal line (red), indicating a bullish crossover which supports potential upward momentum.

The histogram is in the positive zone, suggesting momentum is favoring the bulls. The shrinking of histogram bars may suggest declining momentum, requiring monitoring.

No notable divergences are apparent between price action and MACD at this moment, indicating MACD is supporting current price movements.

Volume Analysis

A spike in volume accompanied the recent upward price move, which adds credibility to the bullish turnaround.

The volume spikes align with price increases, which typically supports the authenticity of the move.

An unusual spike in volume occurred during the reversal from the bottom, suggesting potential institutional participation.

Support & Resistance

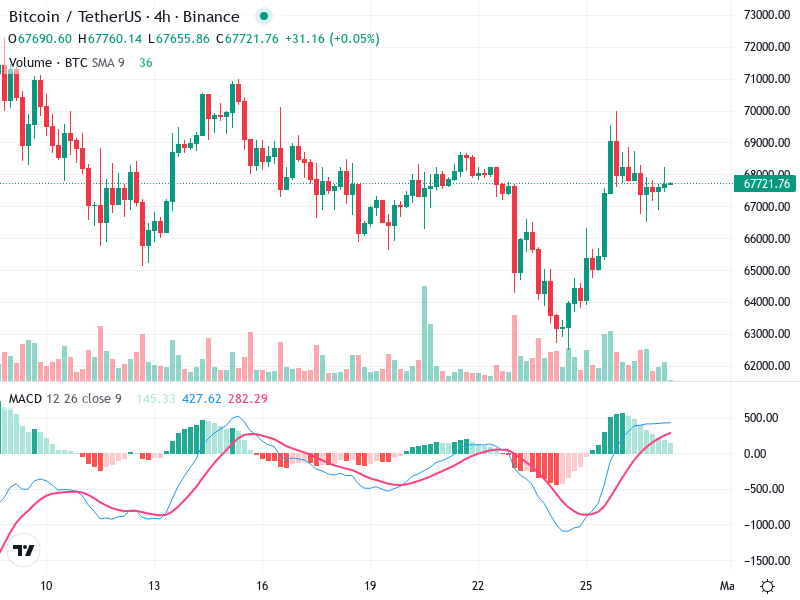
The primary resistance is noted around 68,000, where previous attempts to break above were rejected. A sustained break above this level could signal further upside.

Strong support is seen around 66,000, where price found its floor during the previous decline.

The consolidation pattern suggests market indecision, and traders should be prepared for potential volatility.

Actionable Insights

Consider entering a long position on a confirmed breakout above 68,000 with strong volume.

Watch for signs of rejection or a bearish crossover in MACD as an indication to consider profit-taking.

Holding may be advisable if the price remains above the 66,000 support and MACD continues to favor a bullish stance.

The AI Technical Analysis Center is an informational tool only and does not constitute investment or trading advice.
This site is registered on wpml.org as a development site. Switch to a production site key to remove this banner.