Generic selectors
Exact matches only
Search in title
Search in content
Post Type Selectors

Popular stocks

Crypto

CFD

Currencies

Support

Gold

BTC/USD – Technical Analysis – 4h

September 9, 2025 07:04

Quick Summary

The Bitcoin /TetherUS chart indicates a generally optimistic outlook.

The asset is currently experiencing upward momentum after a series of encouraging patterns.

Candlestick Analysis

The chart shows a recent bullish trend with higher lows and higher highs, indicating a positive momentum.

A bullish engulfing pattern is visible around September 4, which contributed to the upward momentum.

There is a potential breakout zone near the 113,500 level. If this resistance level is breached, it might lead to further bullish movement.

MACD Analysis

Currently, the MACD line is above the Signal line, suggesting a bullish crossover. This indicates growing bullish momentum.

The histogram shows increasing positive bars, reinforcing the strength of the upward move.

No obvious divergences are seen between the MACD and price movement, supporting the current trend.

Volume Analysis

There is noticeable volume supporting the recent price increase, which validates the bullish momentum.

A volume spike coincides with the bullish engulfing pattern, suggesting increased buying interest, possibly institutional activity.

Overall, volume trends confirm the ongoing bullish sentiment.

Support & Resistance

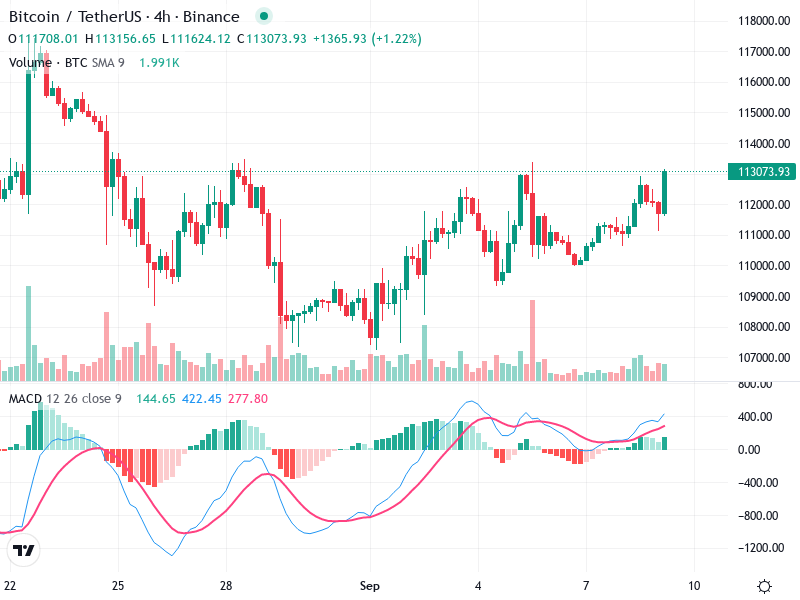
Key support levels are around 111,000, which has previously acted as a consolidation area.

Key resistance levels are near 113,500, which the price is currently testing.

Breaking above the resistance level may trigger further buying, while failure could result in a pullback to the support zone.

Actionable Insights

Consider entry if the price breaks and holds above 113,500 with strong volume. Look for confirmation signals such as continuous bullish candlesticks.

Watch for bearish signals or lack of volume if the price fails to break resistance, which may suggest a potential pullback.

Holding is advisable given the current bullish momentum, but closely monitor for any reversal patterns.

The AI Technical Analysis Center is an informational tool only and does not constitute investment or trading advice.
This site is registered on wpml.org as a development site. Switch to a production site key to remove this banner.