Generic selectors
Exact matches only
Search in title
Search in content
Post Type Selectors

Popular stocks

Crypto

CFD

Currencies

Support

Gold

BTC/USD – Technical Analysis – 4h

September 12, 2025 07:04

Quick Summary

The Bitcoin /TetherUS chart indicates a strong bullish trend as observed through various technical indicators. The upward price movement aligns with increased volume, strengthening the case for continued bullish momentum. Key levels of support and resistance have been identified, providing critical areas to watch for potential breakouts or reversals.

Candlestick Analysis

There is a series of higher highs and higher lows, indicating a bullish trend.

The trend is bullish, as reflected in the rising candlestick pattern.

The price has recently broken out above the previous resistance around 114,000, with a slight pullback visible, indicating testing of newfound support.

MACD Analysis

The MACD line is above the Signal line, suggesting bullish momentum.

The MACD histogram is positive, showing that the bullish momentum is currently strong.

There are no clear divergences between MACD and price action, aligning with the bullish trend observed.

Volume Analysis

Volume increased during the recent price rise, supporting the bullish breakout.

The volume rise along with the price suggests strong buyer interest and validates the price movement.

There are noticeable volume spikes correlated with bullish candlesticks, indicating potential institutional buying.

Support & Resistance

The recent breakout level around 114,000 could act as a new support.

The region near 116,000 is approximate near-term resistance.

Breaking and holding above these levels will be crucial for continued bullish momentum or a potential reversal.

Actionable Insights

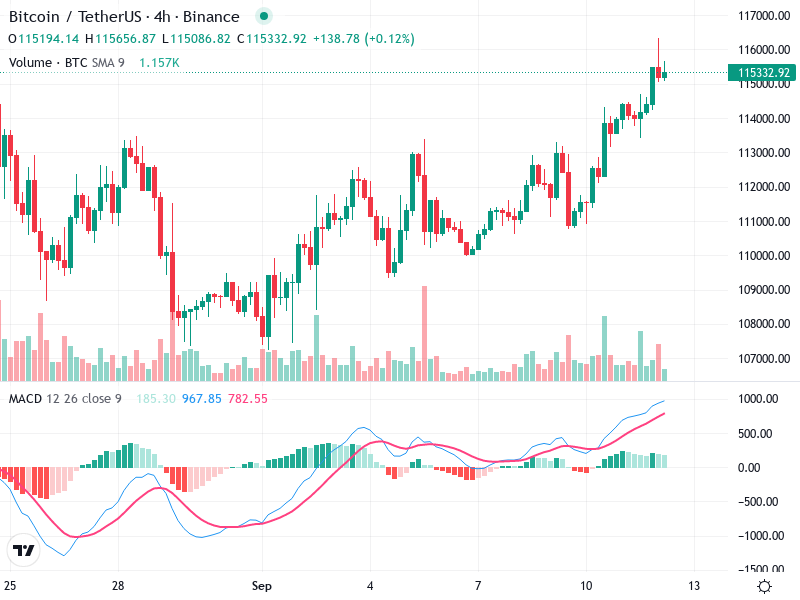
Consider buying on pullbacks to support levels, around or slightly above 114,000, with watches for candlestick confirmations like bullish engulfing.

Be cautious near 116,000 resistance; consider partial profit-taking.

If already invested, monitor closely for any signs of trend reversal or bearish candlestick formations.

The AI Technical Analysis Center is an informational tool only and does not constitute investment or trading advice.
This site is registered on wpml.org as a development site. Switch to a production site key to remove this banner.