September 25, 2025 07:04
The chart illustrates a combination of bullish and bearish sentiments, with potential reversals indicated by recent patterns and technical indicators.
While the asset encounters resistance, the downward momentum signified by certain indicators suggests careful monitoring.
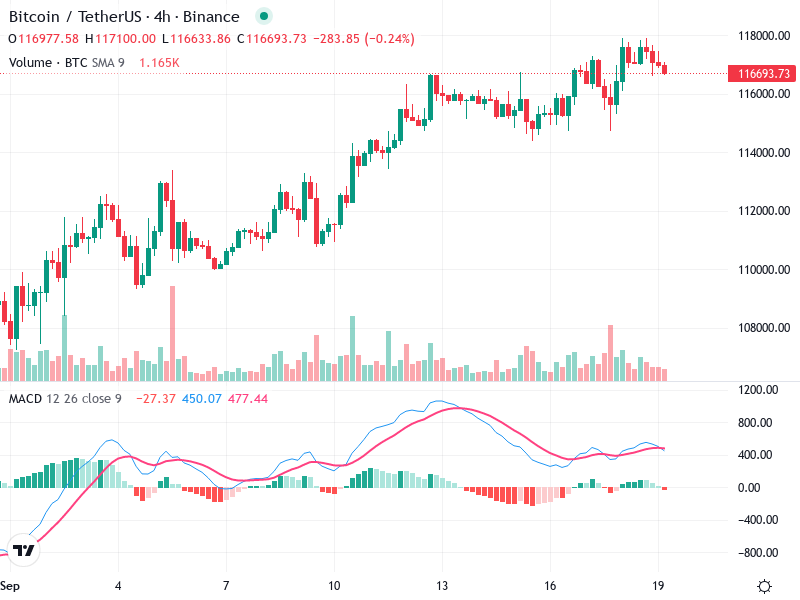
The chart shows a generally bullish trend over the observed period, with a series of higher highs and higher lows.
Around the middle of the chart, there is a noticeable bullish engulfing pattern, suggesting upward momentum.
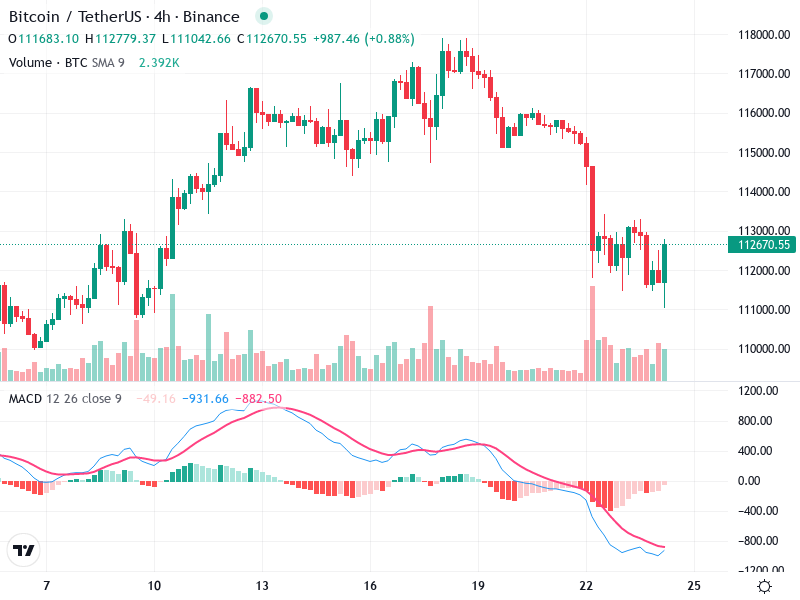
Near the recent candles, there’s a potential doji, indicating market indecision which may suggest a possible reversal or consolidation.
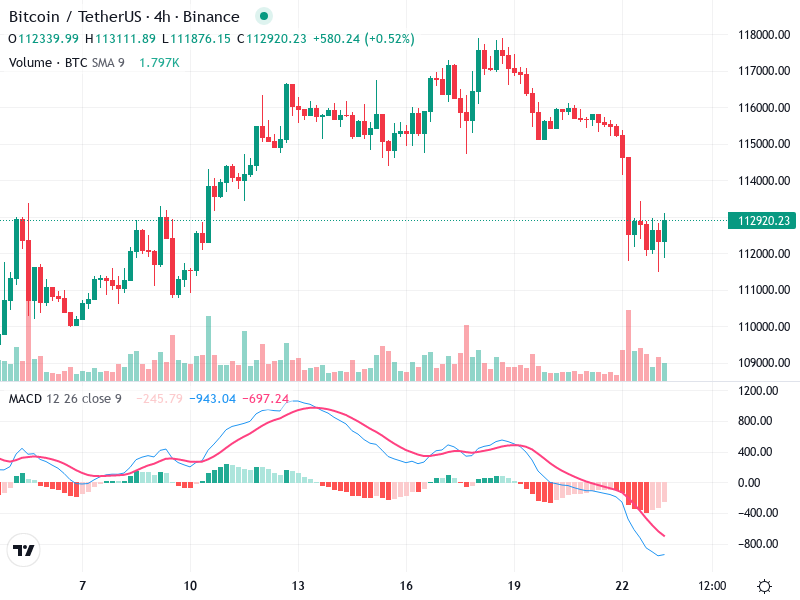
The MACD line is below the Signal line, indicating a bearish crossover recently occurred, which may suggest decreasing momentum.
The histogram is below the zero line and widening, reinforcing bearish sentiment and indicating increasing downward momentum.
There is no significant divergence observed between price action and the MACD, confirming the bearish sentiment.
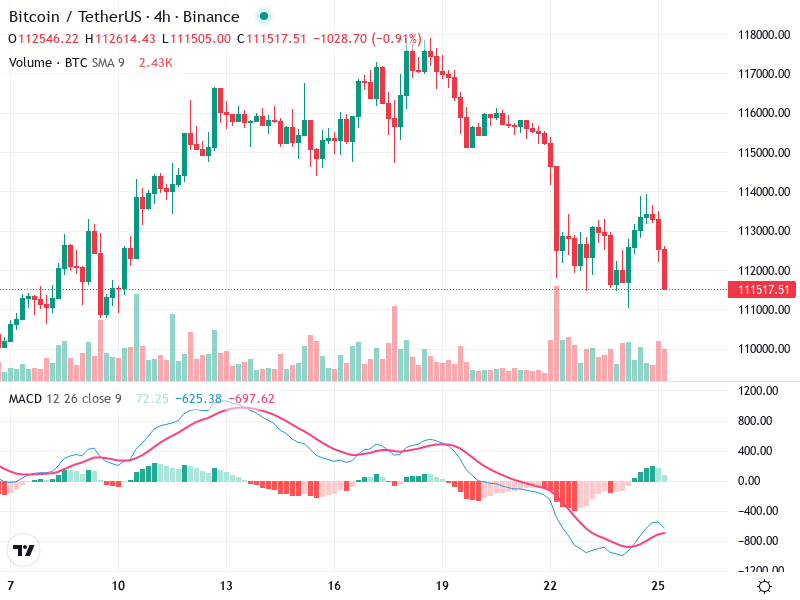
Volume spikes are observed at several points, particularly during bullish runs, indicating strong buyer interest.
Recent increase in volume does not fully support the price decline, which may indicate selling pressure is not overwhelmingly strong or is temporary.
The spike in volume around the earlier bullish movements suggests potential institutional buying.
Key support level can be identified around 114,000, where previous pullbacks have bounced.
The area near 117,000 represents strong resistance, as seen by recent price rejections.
Consider a cautious approach; monitor for confirmation of the bearish crossover in MACD before positioning for possible short-term declines.
Await a clear breakout above the resistance for buy signals, or a breakdown below support for sell signals.
Look for further volume spikes to validate any upcoming breakout or breakdown.