Generic selectors
Exact matches only
Search in title
Search in content
Post Type Selectors

Popular stocks

Crypto

CFD

Currencies

Support

Gold

BTC/USD – Technical Analysis – 4h

September 22, 2025 07:04

Quick Summary

The chart exhibits significant bearish characteristics, with recent trends indicating a downturn. Observations suggest pressure may continue unless support levels are upheld.

MACD and volume metrics align with the prevailing bearish sentiment, pointing to potential challenges in reversing the current trend.

Candlestick Analysis

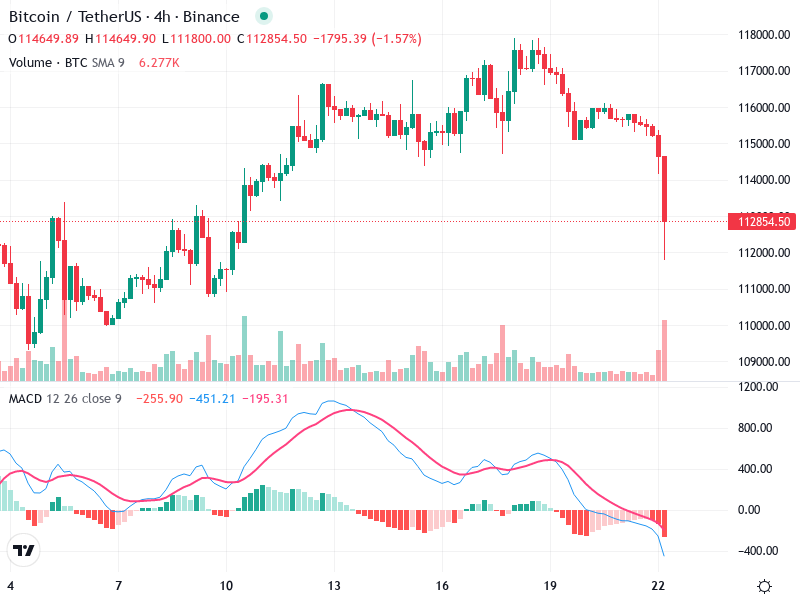
There is a strong bearish candlestick on the right side, indicating increased selling pressure.

The recent session shows a long red candle, suggesting a bearish sentiment.

The trend is currently bearish, as seen by the downward movement of the price, especially in the recent candlesticks.

MACD Analysis

The MACD line is below the Signal line, confirming a bearish crossover.

The histogram bars are growing negatively, further supporting the bearish momentum.

There is no visible bullish divergence; the MACD confirms the bearish price action.

Volume Analysis

There is a notable spike in volume accompanying the recent price drop, indicating strong selling interest.

The high volume on the downside suggests that the bearish move is supported by a substantial amount of selling, likely driven by institutional activity.

The volume spike aligns with the strong downward candle, indicative of a significant market sentiment shift.

Support & Resistance

The current price is testing a previous support level around 112,000.

If this level breaks, further declines could be expected.

The previous rebound zone near 116,000 could act as resistance if the price makes an attempt to recover.

Actionable Insights

Traders might consider short positions if the price remains below key support.

Watching for confirmation of continued bearish strength will be essential.

A recovery and stabilization above 112,000 could suggest potential for a reversal, but confirmation would be needed with volume and possibly a bullish candlestick pattern.

The AI Technical Analysis Center is an informational tool only and does not constitute investment or trading advice.
This site is registered on wpml.org as a development site. Switch to a production site key to remove this banner.