Generic selectors
Exact matches only
Search in title
Search in content
Post Type Selectors

Popular stocks

Crypto

CFD

Currencies

Support

Gold

BTC/USD – Technical Analysis – 4h

September 23, 2025 07:05

Quick Summary

The Bitcoin /TetherUS chart shows a potential for reversal as suggested by the candlestick patterns.

The MACD indicator hints at diminishing bearish momentum, which could lead to a bullish crossover.

Volume analysis indicates growing buying interest at lower levels, which might support a rally.

Candlestick Analysis

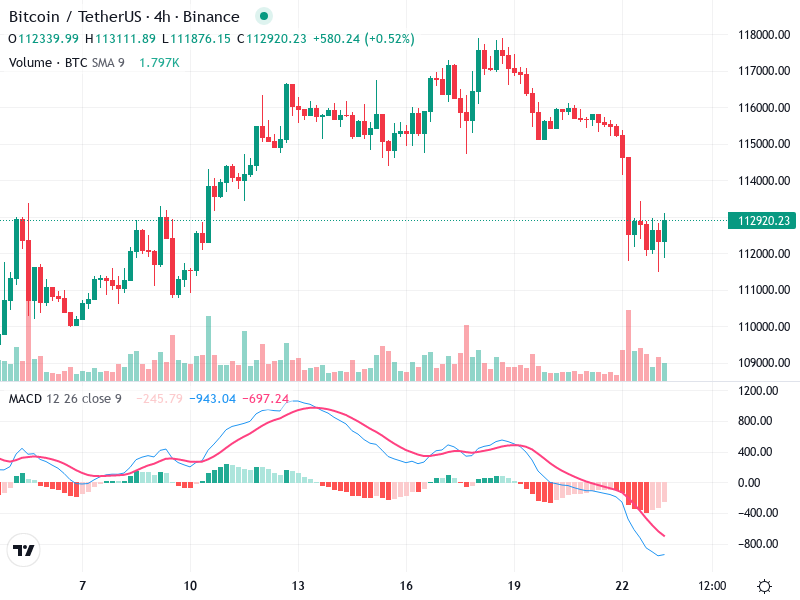
There appears to be a potential bullish engulfing pattern after a downtrend, indicating a possible reversal.

The broader trend is bearish, with a sustained price decline from around 117,000 to 112,000.

Possible breakout zone is near 113,000, where previous support turned resistance might be tested.

MACD Analysis

The MACD line is below the Signal line, showing bearish momentum, but convergence suggests a potential bullish crossover.

The histogram indicates decreasing bearish momentum, reflecting weakening selling pressure.

No clear divergences are observed between MACD and price action at this time.

Volume Analysis

An upward spike in volume after the downtrend corresponds to the potential reversal pattern, supporting a trend change.

Reduced volume during the decline suggests weaker selling pressure, and increased volume indicates buying interest.

The spike in buying volume suggests possible institutional interest at lower levels.

Support & Resistance

Key support is identified around 111,800, where price stopped declining.

The resistance level seems to be around 113,000, aligning with previous price peaks and troughs.

This resistance level could potentially cause reversals.

Actionable Insights

Consider a buy if the price breaks above 113,000 with strong volume, but set stops below 111,800 to manage risk.

Watch for confirmation of a bullish crossover in the MACD, which would further support a buying strategy.

A failure to break 113,000 with convincing volume might signal further declines.

The AI Technical Analysis Center is an informational tool only and does not constitute investment or trading advice.
This site is registered on wpml.org as a development site. Switch to a production site key to remove this banner.