Generic selectors
Exact matches only
Search in title
Search in content
Post Type Selectors

Popular stocks

Crypto

CFD

Currencies

Support

Gold

BTC/USD – Technical Analysis – 4h

September 26, 2025 07:04

Quick Summary

The Bitcoin /TetherUS chart is currently displaying a bearish trend with prices dropping from recent highs. Technical indicators support potential short-selling opportunities if the bearish sentiment continues.

Traders should closely monitor key support levels for potential breakouts or reversals.

Candlestick Analysis

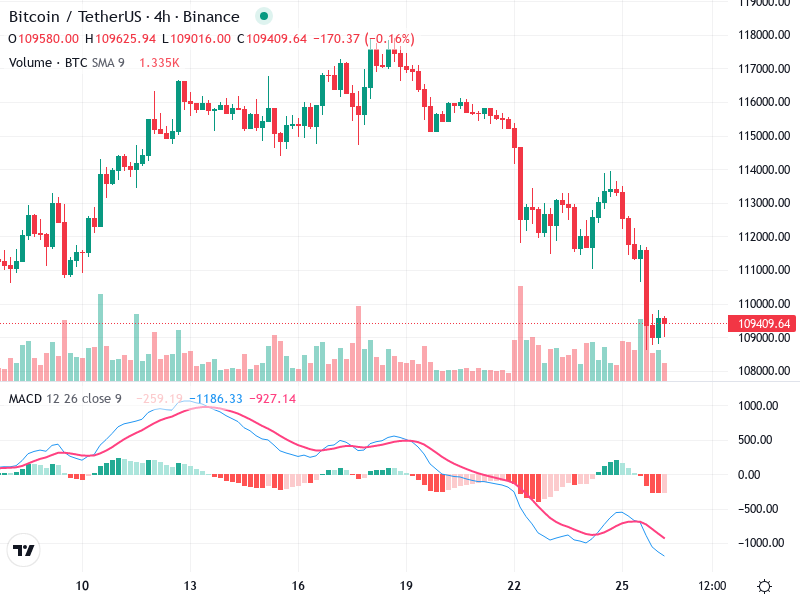
The chart shows a bearish trend as prices have been declining from recent highs around 117,000 to near 109,000.

There are no clear single-session reversal patterns like hammers or bullish engulfing near the latest candlesticks. However, multiple red candles confirm bearish sentiment.

A potential pullback can be observed as the most recent candles show some consolidation around the 109,000 level. This could be a temporary support zone.

MACD Analysis

The MACD line (blue) is below the Signal line (red), indicating a bearish crossover which often signifies continued downward momentum.

The histogram displays red bars below the zero line, indicating sustained bearish momentum. The decreasing size of recent bars could suggest a possible weakening of this momentum.

No clear divergence is evident between the MACD and the price action at the moment.

Volume Analysis

The volume shows a significant increase around major downward price moves, confirming bearish sentiment.

The large red volume bars coincide with price drops, highlighting strong selling pressure likely from institutional activity.

Continued monitoring of volume changes is essential to anticipate potential shifts in market sentiment.

Support & Resistance

Strong resistance appears around 111,000 based on recent price action where declines accelerated after reaching this level.

The current support level stands around 108,000-109,000, as prices are consolidating here.

Monitoring these levels is crucial for identifying potential breakouts or breakdowns.

Actionable Insights

Continuing bearish trend and bearish MACD crossover suggest short-selling opportunities.

Conservative traders might wait for clear signs of reversal (e.g., bullish patterns or MACD crossover) before entering long positions.

Watch for confirmations of breakdown below 108,000 or false breakdown with volume drop-off for potential reversals.

The AI Technical Analysis Center is an informational tool only and does not constitute investment or trading advice.
This site is registered on wpml.org as a development site. Switch to a production site key to remove this banner.