Generic selectors
Exact matches only
Search in title
Search in content
Post Type Selectors

Popular stocks

Crypto

CFD

Currencies

Support

Gold

BTC/USD – Technical Analysis – 4h

September 30, 2025 07:04

Quick Summary

The chart of [Asset] reveals a distinct bullish momentum, originating from the market lows at the end of September. This upward movement is marked by consistent green candlesticks and emerging patterns that suggest potential growth.

Key levels and indicators align to support the ongoing trend, hinting at possible future gains.

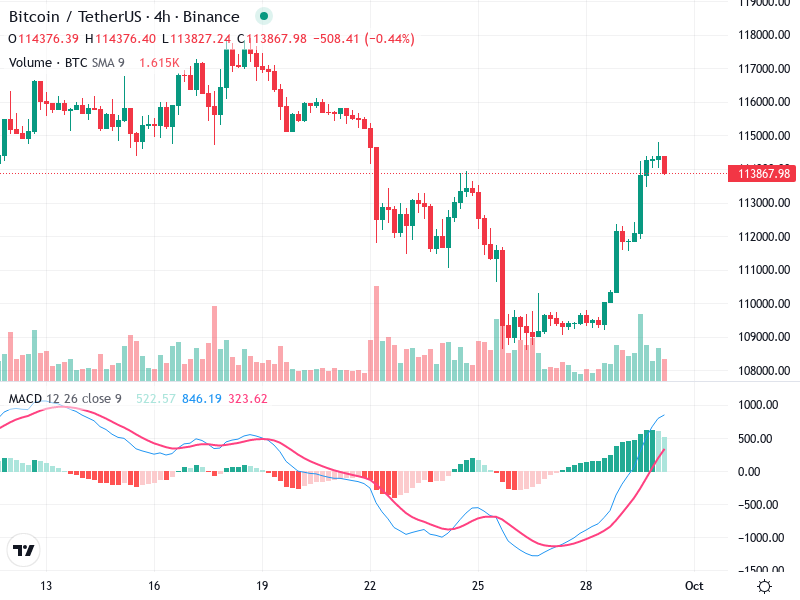
Candlestick Analysis

Significant bullish trend starts from September 28th, confirmed by green candlesticks.

A 'hammer' pattern near lows indicates a shift from bearish to bullish.

Breakout level at 11,350 indicates potential bullish continuation if breached.

MACD Analysis

MACD above Signal line indicates bullish crossover and positive momentum.

Rising MACD histogram supports increasing bullish momentum.

No clear divergences; MACD aligns well with price trend.

Volume Analysis

Volume increase during bullish move supports uptrend strength.

Corresponding rise in volume and price indicates strong buying interest.

Initial volume spike suggests institutional interest or major market moves.

Support & Resistance

Support found around 11,000, serving as a base for uptrend.

Resistance expected near 11,500, a zone of past price reaction.

Watching these levels can guide trade entry and exits.

Actionable Insights

Consider long position if price closes above 11,500 with strong volume.

Bearish signals, like MACD crossover, may advise selling below 11,250.

Hold positions if price remains above support with bullish trend intact.

The AI Technical Analysis Center is an informational tool only and does not constitute investment or trading advice.
This site is registered on wpml.org as a development site. Switch to a production site key to remove this banner.