Generic selectors
Exact matches only
Search in title
Search in content
Post Type Selectors

Popular stocks

Crypto

CFD

Currencies

Support

Gold

BTC/USD – Technical Analysis – 4h

August 26, 2025 07:11

Quick Summary

The chart depicts a series of bearish candles, interspersed with small-bodied bullish ones. A hammer-like candle suggests potential buying pressure at the lows.

The overall trend remains bearish with lower highs and lows, but there’s a potential for a reversal or pullback.

Candlestick Analysis

The chart shows a series of bearish candles with occasional small-bodied bullish candles.

Notably, there's a hammer-like candle at the low point, suggesting potential buying pressure.

The trend is clearly bearish with lower highs and lower lows, with recent signs of a potential reversal.

MACD Analysis

The MACD line is below the Signal line, indicating a bearish trend.

The lines are converging, suggesting a potential bullish crossover in the near future.

The MACD histogram is negative but showing decreasing red bars, indicating weakening bearish momentum.

Volume Analysis

There is a noticeable increase in volume during the recent decline, supporting the bearish trend.

The increased volume on the recent downtrend supports the bears, but the volume spike during the hammer candle suggests possible institutional buying.

A significant spike during the attempt to reverse suggests increased interest at lower price levels.

Support & Resistance

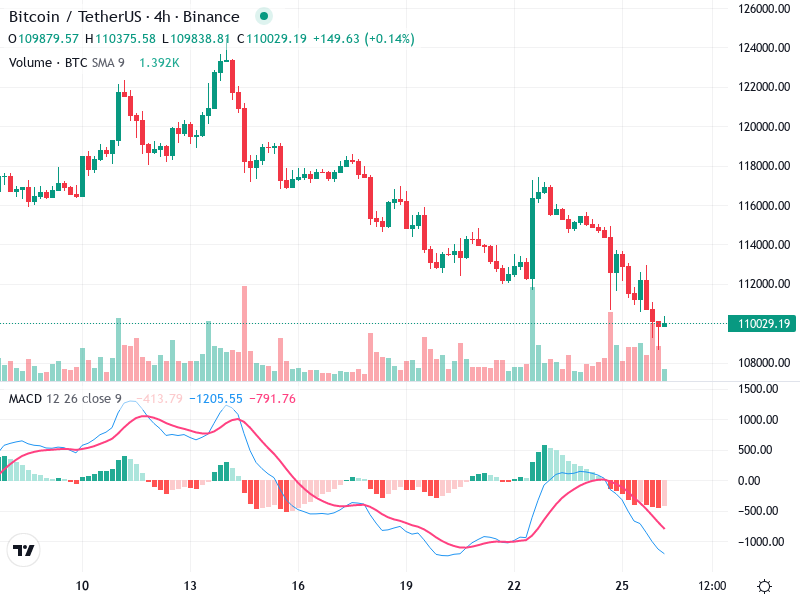
Current support is around 108,000, where buying pressure has been detected.

Resistance is expected near 114,000, where the recent uptrend failed previously.

Breaking below the support may lead to further downside, while a move above the resistance could signify a trend reversal.

Actionable Insights

Consider buying if a bullish crossover on the MACD is confirmed and the price moves above the 114,000 resistance with strong volume.

Continue to hold bearish positions if the price falls below 108,000 with increasing volume.

For current holders, closely monitor the MACD for a bullish crossover signal and watch for a confirmation of support around 108,000.

The AI Technical Analysis Center is an informational tool only and does not constitute investment or trading advice.
This site is registered on wpml.org as a development site. Switch to a production site key to remove this banner.