Generic selectors
Exact matches only
Search in title
Search in content
Post Type Selectors

Popular stocks

Crypto

CFD

Currencies

Support

Gold

BTC/USD – Technical Analysis – 4h

October 3, 2025 07:04

Quick Summary

The chart for the asset demonstrates a strong upward trajectory, with significant bullish momentum noted in recent sessions.

Key levels to watch include resistance around 120,000 and support near 116,000, with potential implications for future price action.

Candlestick Analysis

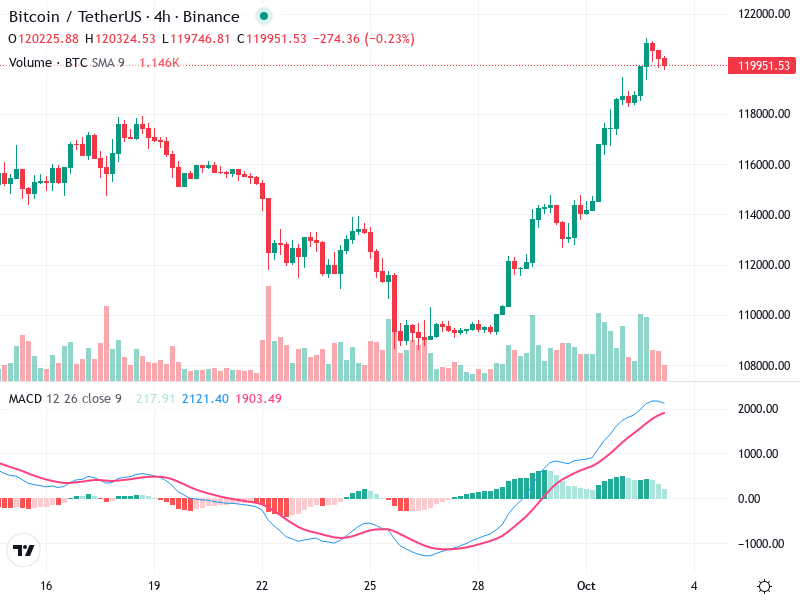
The chart shows a strong bullish trend with successive green candles leading to the recent high. There is a potential formation of a bearish doji or spinning top at the peak, indicating possible indecision or a reversal.

The trend is currently bullish, given the series of higher highs and higher lows.

A significant breakout occurred around 112,000, leading to the continued upward movement. The price now faces resistance near 120,000.

MACD Analysis

The MACD line is above the Signal line, confirming the bullish momentum. However, the lines are converging, suggesting a weakening momentum.

The histogram bars are decreasing, indicating dwindling bullish momentum. Watch for a potential bearish crossover if the current trend persists.

There is no clear divergence between MACD and price action at the moment.

Volume Analysis

Volume increased during the initial breakout but seems to be declining as the price consolidates at higher levels.

Volume supported the initial bullish movement but its recent decrease suggests a weakening conviction in the current price level.

A notable volume spike coincided with the breakout around 112,000, possibly indicating institutional buying.

Support & Resistance

The current resistance is near 120,000. A failure to break this could lead to a pullback.

Key support is around 116,000, followed by the breakout level around 112,000.

Actionable Insights

Consider taking profit or tightening stop-losses due to potential reversal signals (e.g., doji pattern). New entries should wait for confirmation of a breakout above 120,000.

Look for confirmation of a reversal with bearish candlestick patterns or a MACD crossover. Keep an eye on volume changes for further confirmation.

The AI Technical Analysis Center is an informational tool only and does not constitute investment or trading advice.
This site is registered on wpml.org as a development site. Switch to a production site key to remove this banner.