Generic selectors
Exact matches only
Search in title
Search in content
Post Type Selectors

Popular stocks

Crypto

CFD

Currencies

Support

Gold

BTC/USD – Technical Analysis – 4h

October 14, 2025 07:04

Quick Summary

The Bitcoin /TetherUS chart on the 4-hour timeframe shows significant bearish pressure. The recent price action and technical indicators highlight potential zones of support and resistance, crucial for traders monitoring the asset. Market sentiment, along with volume and momentum indicators, suggest careful observation is needed.

Candlestick Analysis

A series of bearish candlesticks are observed, indicating downward pressure.

No clear reversal patterns like hammers or dojis are evident in the recent action.

The trend is currently bearish, as seen from the descending price action following the peak around October 5th.

MACD Analysis

The MACD line is below the Signal line, indicating bearish momentum.

The recent narrowing of the distance between the MACD and Signal lines suggests potential for a bullish crossover if upward price action continues.

No visible divergence is noted between MACD and price in this timeframe, aligning both indicators with the prevailing bearish sentiment.

Volume Analysis

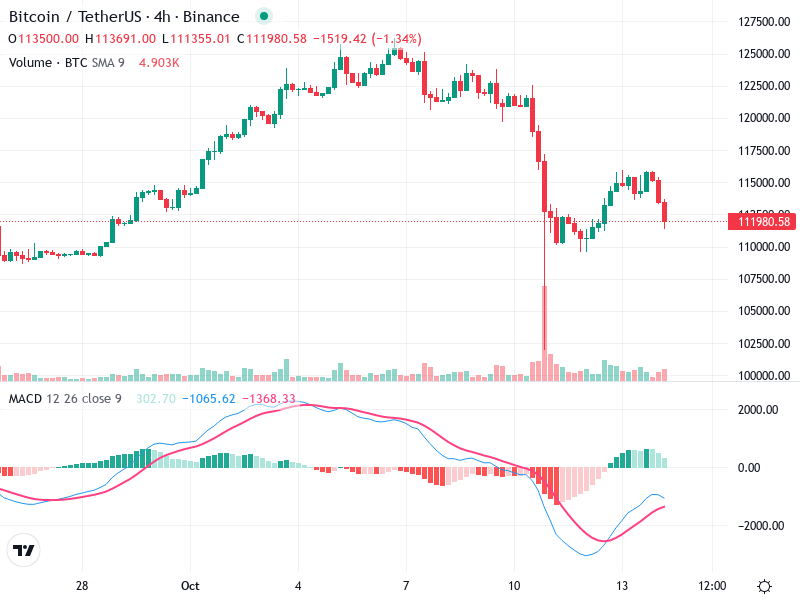
Noticeable spike in volume accompanies the large bearish candles around October 9th, confirming aggressive selling pressure likely by institutional traders.

High volume during the sell-off supports the downward movement, suggesting strong conviction in the bearish trend.

The aforementioned volume spike indicates possible exhaustion of selling pressure, potentially leading towards stabilization or a reversal.

Support & Resistance

Key support appears around $110,000, where price might find buying interest.

Resistance is seen near $115,000, just below the previous consolidation before the recent drop.

These levels are crucial for monitoring potential reversals or further decline.

Actionable Insights

Consider monitoring the $110,000 support for signs of reversal before entering long positions.

Current holders might reassess positions if price breaches $110,000 decisively with heavy volume.

Traders should watch for confirmation signals like bullish MACD crossover or a strong volume-backed reversal candlestick at support.

The AI Technical Analysis Center is an informational tool only and does not constitute investment or trading advice.
This site is registered on wpml.org as a development site. Switch to a production site key to remove this banner.