Generic selectors
Exact matches only
Search in title
Search in content
Post Type Selectors

Popular stocks

Crypto

CFD

Currencies

Support

Gold

BTC/USD – Technical Analysis – 4h

October 16, 2025 07:04

Quick Summary

The 4-hour chart for Bitcoin /TetherUS shows a predominant bearish trend with attempts at consolidation. The asset initially experienced a significant downturn before entering a sideways pattern.

Notable resistance and support levels are at 115,000 and 111,000, respectively, suggesting key areas for potential reversals or breakouts.

Candlestick Analysis

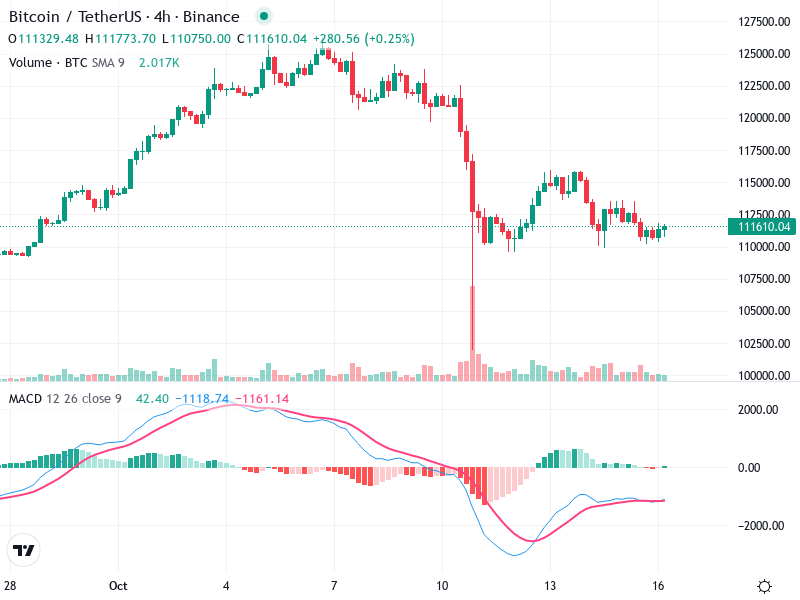
The chart shows a bearish trend followed by a sideways or consolidation pattern. Initially, there was a strong downtrend visible by consecutive large red candlesticks.

Around the 7th, a cluster of red candles signifies a strong bearish sentiment. Some candlesticks resemble a doji or hammer near the recent lows, suggesting potential indecision or reversal attempts.

The area around 115,000 marks a resistance zone for recent movements where price retreated after attempts to move higher.

MACD Analysis

Both the MACD line and Signal line are below the zero line, which confirms bearish momentum. However, they are converging, suggesting weakening bearish momentum.

No bullish crossover is observed yet, indicating caution for bulls.

The histogram bars are shrinking in size, suggesting a reduction in bearish momentum and possibly a range-bound market.

Volume Analysis

A significant spike in volume occurred around the sharp drop, indicating strong selling pressure, possibly from institutions.

Recent volume levels are average, suggesting a decrease in activity as the market consolidates.

Current volume does not strongly support any direction, aligning with the sideways trend.

Support & Resistance

Around 111,000 - This area has acted as a recent support where the price has repeatedly bounced.

Around 115,000 - This level has acted as resistance in the recent attempt to rebound from the lows.

These levels are key to determining potential breakout or reversal points.

Actionable Insights

Consider entry if price breaks above 115,000 with volume support and a confirmed MACD bullish crossover.

Short positions could be considered if the price falls below the support level at 111,000 with increased volume.

Watch for a confirmed MACD crossover and an increase in volume for potential bullish reversal confirmation.

The AI Technical Analysis Center is an informational tool only and does not constitute investment or trading advice.
This site is registered on wpml.org as a development site. Switch to a production site key to remove this banner.