Generic selectors
Exact matches only
Search in title
Search in content
Post Type Selectors

Popular stocks

Crypto

CFD

Currencies

Support

Gold

BTC/USD – Technical Analysis – 4h

August 27, 2025 07:11

Quick Summary

The chart illustrates a predominant bearish trend with notable price consolidations.

Traders should watch for potential reversal signals, especially around key levels.

Candlestick Analysis

The chart does not show clear patterns like bullish engulfing or hammer but does indicate some indecision with smaller candles near the current price level.

The trend is predominantly bearish, with a series of lower highs and lower lows observable across the chart.

The recent price movement shows a potential pullback after a strong downward push around the 21st to the 22nd. Prices are consolidating around the $111,000 mark, hinting at potential volatility.

MACD Analysis

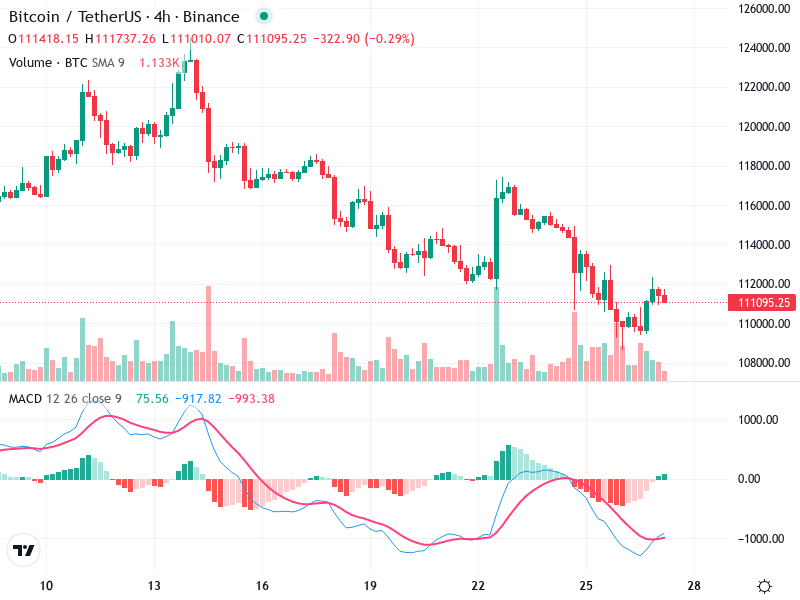
Currently, the MACD line is below the Signal line, indicating bearish momentum. However, the lines have started to converge, which might suggest a potential reversal if a crossover occurs.

The histogram is negative, supporting a bearish trend, but bars are gradually getting smaller, which could indicate weakening downward momentum.

No significant divergences between MACD and price are evident, but the convergence of lines suggests momentum may be changing.

Volume Analysis

Notable increase in volume during the sharp price decline around the 22nd, indicating strong selling pressure which could be institutional.

The decrease in volume during the recent price consolidation suggests a lack of conviction among traders.

Large volume spikes correlate with the price drop, highlighting significant interest and potential sell-off.

Support & Resistance

Near $111,000, since prices are currently consolidating here.

Around $114,000, where past price consolidations stalled.

Support and resistance levels are critical for identifying potential breakout points.

Actionable Insights

Watch for a bullish crossover in MACD and increased volume to validate upward momentum. Consider buying on a strong breach above $114,000.

Selling pressure remains dominant. If price breaks below $110,000 with strong volume, it could indicate further downside.

Hold in case of consolidation with low volume, waiting for clearer directional signs.

The AI Technical Analysis Center is an informational tool only and does not constitute investment or trading advice.
This site is registered on wpml.org as a development site. Switch to a production site key to remove this banner.