Generic selectors
Exact matches only
Search in title
Search in content
Post Type Selectors

Popular stocks

Crypto

CFD

Currencies

Support

Gold

BTC/USD – Technical Analysis – 4h

October 20, 2025 07:04

Quick Summary

The asset’s chart analysis reveals key insights into its current state. It displays trends that suggest a possible momentum shift.

This analysis is crucial for anticipating future price movements and making informed trading decisions.

Candlestick Analysis

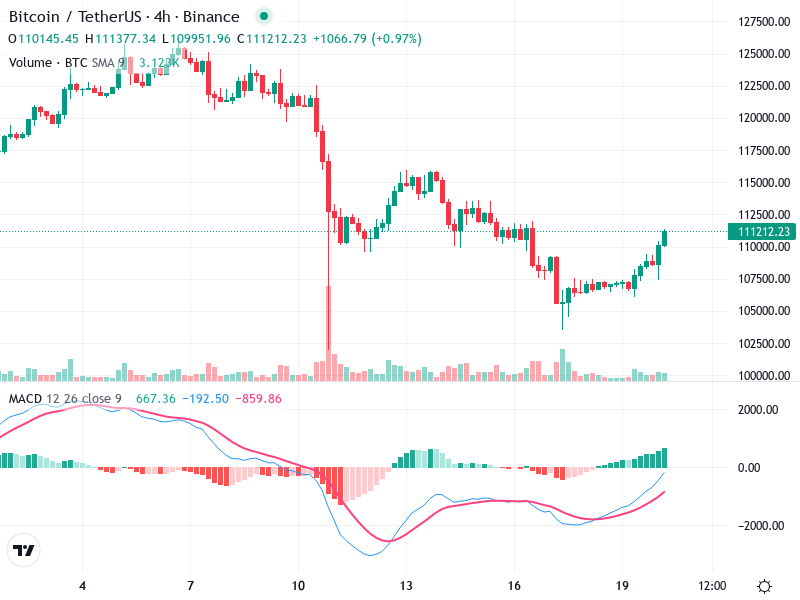
The chart shows a recovery from a prior downtrend. The current movement appears to be bullish, with increasing size in green candlesticks.

Near the recent low, a potential hammer pattern suggests a reversal from the bearish trend, followed by a series of bullish candles indicating a shift in momentum.

The recovery has pushed past the 111,000 level, which can be a key breakout zone. A close above this level can further confirm bullish intent.

MACD Analysis

The MACD line has crossed above the Signal line, indicating a bullish crossover. This typically suggests a potential upward momentum.

The MACD histogram is turning positive, supporting the bullish crossover with increasing momentum.

No clear divergences are observed between price action and MACD, supporting the current upward movement.

Volume Analysis

An earlier spike in volume coincides with a large downwards move, suggesting prior selling pressure was strong.

The recent upward price move is supported by a slight increase in volume, hinting at genuine buying interest.

There was an earlier high-volume candle, likely indicative of institutional activity either entering or exiting positions.

Support & Resistance

Key support is around 107,500, which acted as the recent low and potential reversal point.

The 112,500 level appears to be a significant resistance, aligned with previous highs.

These levels are crucial for determining potential changes in market direction.

Actionable Insights

Consider entering a position if the price maintains above the 111,000 level with supporting volume.

Caution is required if the price moves below the 107,500 support level, as it may suggest a return to bearish sentiment.

Monitor for a sustained break above 112,500 for potential continuation.

The AI Technical Analysis Center is an informational tool only and does not constitute investment or trading advice.
This site is registered on wpml.org as a development site. Switch to a production site key to remove this banner.