October 30, 2025 08:04
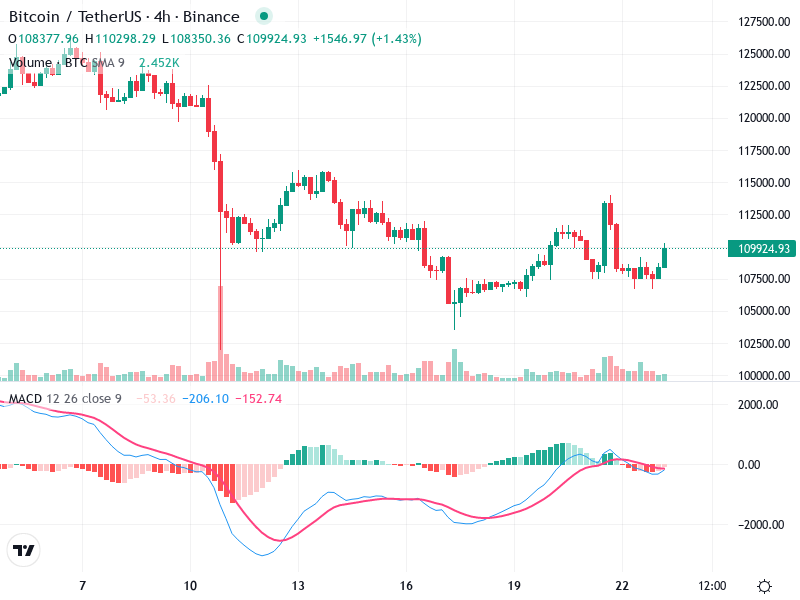
The BTC/USDT 4-hour chart is showing a potential shift towards bullish sentiment. The asset has been recovering from a recent low, indicating a possible move to a bullish phase. Technical indicators suggest an increase in buying interest.
The BTC/USDT chart shows a trend shift from a downtrend to a sideways or bullish phase, recovering from a recent low.
There is a series of bullish candles forming after consolidation, indicating potential buying interest.
The current price level around 109,924.93 is a potential breakout zone, suggesting upward momentum if sustained.
The MACD line has crossed above the Signal line, indicating a bullish crossover, typically a buy signal.
The histogram is slightly positive, suggesting an increase in bullish momentum.
No significant divergences are observed between MACD and price action, aligning with the current upward price movement.
There is an observable increase in volume during upward price movements, supporting recent bullish price action.
Notable volume spikes indicate potential institutional interest, lending credibility to the upward momentum.
The rise in volume supports the bullish crossover seen in the MACD, confirming the trend shift.
A key support level is around 107,500 where recent buying has supported upward moves.
The next significant resistance is near 112,500, historically acting as both support and resistance.
Monitoring these levels is crucial for understanding potential price movements.
Consider entering if the price holds above 110,000 with strong volume, using 107,500 as a stop-loss.
Watch for potential exhaustion near the 112,500 resistance with decreased volume for exit points.
Current holders should monitor volume and price action near key levels to confirm the trend continuation.