Generic selectors
Exact matches only
Search in title
Search in content
Post Type Selectors

Popular stocks

Crypto

CFD

Currencies

Support

Gold

BTC/USD – Technical Analysis – 4h

October 29, 2025 08:04

Quick Summary

The technical analysis of the asset shows a mix of trends and potential signals. Currently, the asset is experiencing a pullback after a recent bullish run, indicating a period of consolidation. Key support and resistance levels are being tested, which will be crucial in determining the asset’s future direction.

Candlestick Analysis

There appears to be a bearish engulfing pattern near the recent peak, indicating a potential reversal or downward pressure.

A small hammer-like formation is present at the lower end of the recent decline, suggesting potential support.

The chart shows a bullish trend leading up to the recent bearish engulfing, and a subsequent pullback suggests some consolidation or correction is occurring.

MACD Analysis

The MACD line is crossing below the Signal line, indicating a bearish crossover, which suggests decreasing momentum.

The histogram is showing increasing red bars, further confirming the bearish momentum.

No significant divergences are noted between MACD and price action, aligning current bearish sentiment with price.

Volume Analysis

There was a spike in volume during the bullish rise and a subsequent decline as the price hit resistance around 116,000, signaling a potential reversal.

The reduction in volume during the pullback suggests the recent decline might lack strong selling conviction.

The large volume increase near the highs aligns with potential institutional sell activity or profit-taking.

Support & Resistance

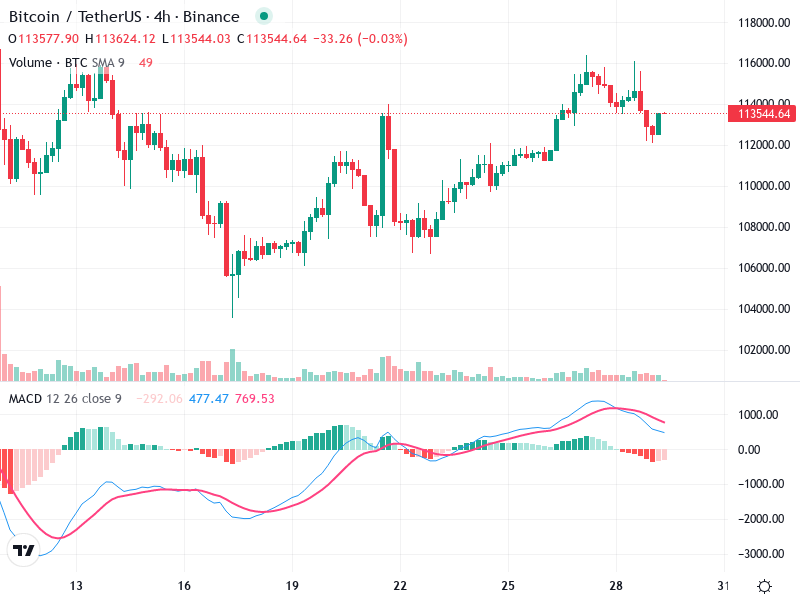
Key support is around 112,000; a break below this could see further declines toward 108,000.

Resistance is critical around 116,000, where recent rejection occurred.

Breakout occurred around the 112,000 level, and the price is currently testing this as a potential support zone.

Actionable Insights

Hold until clear confirmation of support at 112,000.

Buy if the price confirms a reversal pattern above 112,000 with increasing volume.

Sell on a breakdown below 112,000 with accompanying volume increase.

The AI Technical Analysis Center is an informational tool only and does not constitute investment or trading advice.
This site is registered on wpml.org as a development site. Switch to a production site key to remove this banner.