Generic selectors
Exact matches only
Search in title
Search in content
Post Type Selectors

Popular stocks

Crypto

CFD

Currencies

Support

Gold

BTC/USD – Technical Analysis – 4h

August 28, 2025 07:11

Quick Summary

The BTC/USDT 4h chart shows significant price movements, indicating potential market trends. The chart analysis highlights key resistance and support levels that are critical for traders.

Detailed candlestick and MACD analyses reveal possible bullish momentum, while volume analysis provides insights into market participation.

Candlestick Analysis

The recent candlestick pattern shows a series of bullish candles, with one potentially forming a bullish engulfing pattern around the current price level. This suggests increasing bullish momentum.

After a clear downtrend, there appears to be a reversal with short-term bullish momentum.

Recent price action suggests a potential breakout above the $113,500 resistance zone. Watch for a sustained move above this level for a continuation of the bullish trend.

MACD Analysis

The MACD line is above the Signal line, indicating a bullish crossover.

The increasing green bars suggest growing bullish momentum.

No significant divergences observed, which supports the current upward price movement.

Volume Analysis

There's a noticeable increase in volume accompanying the recent upward price movement. This supports the bullish trend.

A large green volume spike aligns with the previous sharp upward price, suggesting potential institutional buying or significant accumulation.

As the price rises, the increasing volume further confirms the bullish sentiment in the market.

Support & Resistance

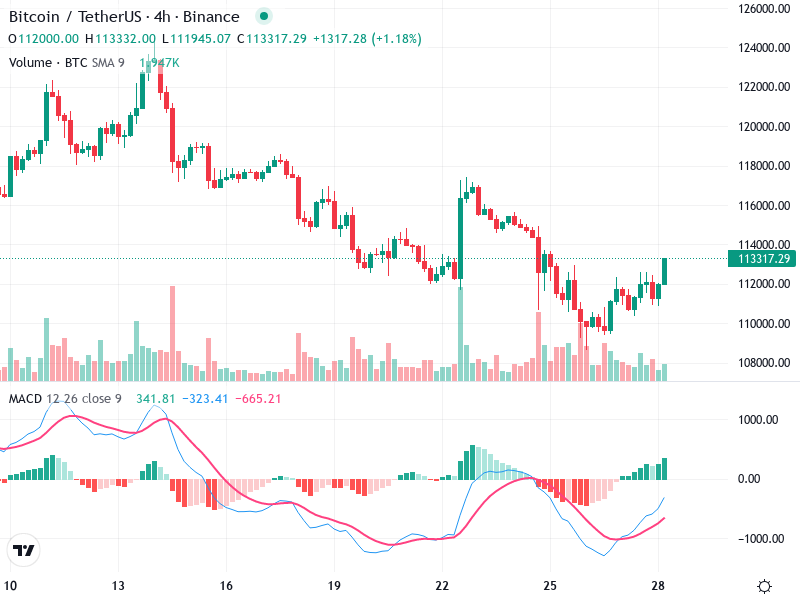
The immediate resistance is around $114,000 to $116,000. A break above this could lead to a move towards the next resistance near $118,000.

Key support levels are identified around $112,000. A drop below this level might reposition the market into a bearish mode.

Maintaining above the resistance levels will be crucial for the continuation of the current trend.

Actionable Insights

Consider buying if the price maintains above $113,500 with increasing volume.

Initiate a sell if the price fails to break above $114,000 and shows signs of reversal.

For current positions, hold and watch for confirmation of a breakout or failure at the resistance level.

The AI Technical Analysis Center is an informational tool only and does not constitute investment or trading advice.
This site is registered on wpml.org as a development site. Switch to a production site key to remove this banner.