Generic selectors
Exact matches only
Search in title
Search in content
Post Type Selectors

Popular stocks

Crypto

CFD

Currencies

Support

Gold

BTC/USD – Technical Analysis – 4h

November 4, 2025 08:04

Quick Summary

The 4-hour chart for Bitcoin /TetherUS reveals a bearish trend with lower highs and lows. The presence of significant bearish candlesticks indicates strong selling pressure. Key support levels may provide potential areas for reversals or further declines.

Continuous monitoring of the MACD and volume indicators is essential to gauge the strength of the bearish movement. Consider broader market conditions for a comprehensive analysis.

Candlestick Analysis

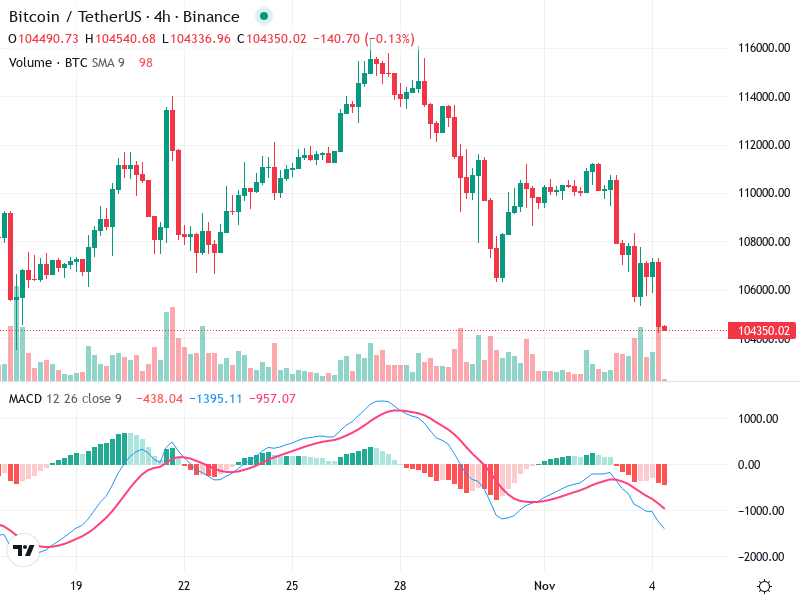
The overall trend appears bearish, marked by lower highs and lower lows from recent peaks.

There is a series of bearish candlesticks, indicating selling pressure. Recently, a long red candle suggests intensified selling, followed by smaller candles indicating a pause or potential consolidation.

The recent trough around 104,000 serves as a potential pullback area where prices could consolidate or attempt a reversal. A break below this level may signal further downside.

MACD Analysis

The MACD line is below the Signal line, indicating a bearish crossover which suggests downward momentum.

The histogram shows increasing negative values, reinforcing the bearish momentum and indicating the strength of the trend.

No significant divergences are observed which suggests that the momentum aligns with the price action.

Volume Analysis

There was a noticeable spike in volume coinciding with the recent large drop in price, suggesting strong selling interest, possibly from institutional investors.

The volume pattern supports the bearish movement, indicating that the decline is backed by higher activity levels, adding confidence to the downward trend.

Monitoring volume changes is crucial as they confirm the strength behind price movements, particularly in a bearish context.

Support & Resistance

Key support is around 104,000, the recent low. If broken, further declines could be seen.

Immediate resistance is around 108,000, followed by another at approximately 112,000.

Understanding these levels can help in identifying potential entry and exit points for trades.

Actionable Insights

Consider selling if the price convincingly breaks below the 104,000 support level with increased volume.

For existing positions, holding might be advisable until clearer reversal signals are observed.

Look for potential bullish reversal patterns like a hammer or bullish engulfing near support levels for potential buy signals.

The AI Technical Analysis Center is an informational tool only and does not constitute investment or trading advice.
This site is registered on wpml.org as a development site.